RY 133.2 0.0676% TD 78.025 0.5866% SHOP 96.1 1.2432% CNR 174.72 -0.6595% ENB 45.8 0.5488% CP 115.47 -0.833% BMO 125.17 -0.6035% TRI 210.69 0.114% CNQ 106.31 -0.6727% BN 53.74 0.4298% ATD 75.54 0.5859% CSU 3733.99 2.3092% BNS 64.15 0.1092% CM 64.69 -0.385% SU 52.18 0.5008% TRP 48.36 -0.4938% NGT 52.96 0.5124% WCN 226.28 -0.5319% MFC 31.42 -0.1589% BCE 44.35 -0.4266%

.png)
Stocks’ Details
Chevron Corporation
Chevron Plans to Offer Shareholder Returns in the Next 5 Years: Chevron Corporation (NYSE: CVX) operates in the integrated energy segment and is engaged in the production and transportation of crude oil and natural gas. Recently, the company revealed its view to offer top shareholders’ returns via systematic capital spending, enhanced cost efficiency, and constant cash flow growth over the coming five years. In doing so, CVX is anticipating shareholder distribution capacity over the next five years to be in the range of ~$75 to $80 billion. Adjusted free cash flow per share is expected to double by 2024, whereas return on capital employed is predicted to be more than 10% over the same time span.
Q4FY19 Operational Highlights for the Period ended 31 December 2019: CVX announced its quarterly results, wherein the company reported total revenues and other income at $36.35 billion as compared to $42.35 billion in the year-ago period. Net loss for the period stood at $6.61 billion as compared to a net profit of $3.73 billion in Q4FY18. The company reported capital and exploratory expenditures for the quarter at ~$6 billion as compared with $5.8 billion in the previous corresponding period. Cash flow from operations for FY19 stood at $27.3 billion as compared to $30.6 billion reported in the previous corresponding period.
.png)
Income Statement Highlights (Source: Company Reports)
Valuation Methodology: Price to Earnings Multiple Based Relative Valuation.png)
Price to Earnings Based Valuation (Source: Thomson Reuters)
Note: All forecasted figures and peers have been taken from Thomson Reuters, NTM-Next Twelve Months
Stock Recommendation: The stock of CVX closed at $57.39 with a market capitalization of ~$107.8 billion. The stock is currently quoting at the lower band of its 52-week trading range of $51.6 to $127.34. The stock has generated negative return 51.42% and 54.19% in the last three months and in a year’s time, respectively. Considering the aforesaid facts, we have valued the stock using price to earnings multiple based relative valuation method. For the matter, we have taken the peer group - Exxon Mobil Corp (NASDAQ: XOM), ConocoPhillips (NASDAQ: COP), Marathon Oil Corp (NASDAQ: MRO), to name few, and arrived at a target price of lower double-digit growth (in % terms). Hence, we recommend a “Buy” rating on the stock at the closing price of $57.39, up 4.25 % as on 19 March 2020.
Malibu Boats, Inc.
Net Sales Up ~8.6% Year Over Year: Malibu Boats, Inc. (NASDAQ: MBUU) is involved in the manufacturing, distribution and marketing of a wide range of recreational powerboats.
Q2FY20 Financial Highlights for the period ending 31 December 2019: The company’s net sales increased 8.6% year over year and came in at $180.1 million, aided by robust growth across the company’s Cobalt and Pursuit brands and best-in-class vertical integration initiatives. Notably,net sales per unit increased 6% year over year, whereas gross profit for the period went up by 4.1% and came in at $39.9 million. The company reported net income of $17.6 million, up 17.3% year over year. Adjusted EBITDA stood at $30.7 million, an increase of 4.5% on a year over year basis. The company reported its selling and marketing expenses at $4.7 million, depicting an increase of 1.4% on y-o-y basis.
.png)
Key Highlights (Source: Company Reports)
Outlook: For FY20, the business expects consolidated net sales to grow at high-to- single-digit on % terms. Gross margin is expected to improve slightly, excluding the impact of UAW strike. MBUU expects adjusted EBITDA margin flat in FY20, excluding impact of UAW strike. Capital expenditure is expected to be between $40 million to $45 million, while MBUU expects a hit of less than $3 million in its profitability due to UAW strike impact.
Valuation Methodology: Price to Earnings Multiple Based Relative Valuation.png)
Price to Earnings Based Valuation (Source: Thomson Reuters)
Note: All forecasted figures and peers have been taken from Thomson Reuters, NTM-Next Twelve Months
Stock Recommendation: The stock of MBUU closed at $26.11 with a market capitalization of ~$537.5 million. The stock is currently quoting at the lower band of its 52-week trading range of $22.84 to $52.13. New product development, operational excellence initiatives, unparalleled vertical integration along with numerous strategies are few key positives. Considering the aforesaid facts, we have valued the stock using a relative valuation method, i.e., price to earnings multiple. For the matter, we have taken the peer group - Brunswick Corp (NYSE: BC), Six Flags Entertainment Corp (NYSE: SIX), SeaWorld Entertainment Inc (NYSE: SEAS), to name few, and arrived at a target price of lower double-digit growth (in % terms). Hence, we recommend a “Buy” rating on the stock at the closing price of $26.11, up 4.94% as on 19 March 2020.
The Walt Disney Company
DIS to Roll Out “Frozen 2” in the US:The Walt Disney Company (NYSE: DIS) is an entertainment company and operates in four business segments: Media Networks, Studio Entertainment Parks and Resorts, and Consumer Products & Interactive Media. On 13 March 2020, the company announced that “Frozen 2” will arrive in the U.S about 3 months earlier on Disney+ commencing from March 15, 2020. The move is a part of company’s strategy to bring fun and joy to families amid this challenging phase of coronavirus outbreak.
Q1FY20 Financial Highlights for the period ending 31 December 2019: During the quarter, the company reported earnings of $1.53 per share, decreasing 17% on a year over year basis. It is to be mentioned that 1QFY29 results consisted the consolidation of TFCF and Hulu LLC (Hulu), which the company started merging on March 20, 2019. Revenues for the quarter came in at $20.86 billion, up 36% year over year, owing to robust growth across all segments, particularly the Studio Entertainment and Direct-to-Consumer (DTC) businesses. Free cash flow at the end of the quarter amounted to $292 million, down from free cash flow of $904 million reported in the year-ago quarter. Cash provided by continuing operations during the quarter amounted to $1.63 billion, as compared to $2.1 billion reported in the year ago period.
.png)
Source: Company Reports
Guidance: For the coming quarter, Disney anticipates the DTC & International segment to report operating losses of ~$900 million. Remarkably, Disney is set to introduce Disney+ in India via the Hotstar service on March 29, 2020, which is a key positive.
Valuation Methodology: Price to Earnings Multiple Based Relative Valuation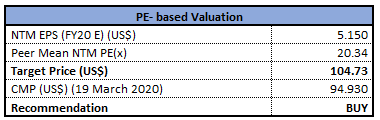
Price to Earnings Based Valuation (Source: Thomson Reuters)
Note: All forecasted figures and peers have been taken from Thomson Reuters, NTM-Next Twelve Months
Stock Recommendation: The stock of DIS closed at $94.93 with a market capitalization of ~$171.39 billion. The stock is currently quoting at the lower band of its 52-week trading range of $79.07 to $153.51. The stock has generated negative return 35.05% and 13.7% in the last three months and in a year’s time, respectively. The company remains on track to benefit from its streaming business and new attractions, that include blockbusters Marvel, Star Wars and Frozen. Considering the aforesaid facts, we have valued the stock using a relative valuation method, i.e., price to earnings multiple. For the matter, we have taken the peer group - News Corp (NASDAQ: NWSA), Fox Corp (NASDAQ: FOXA), Discovery Inc (NASDAQ: DISCA), to name few, and arrived at a target price of lower double-digit growth (in % terms). Hence, we recommend a “Buy” rating on the stock at the closing price of $94.93, up 6.9% as on 19 March 2020.
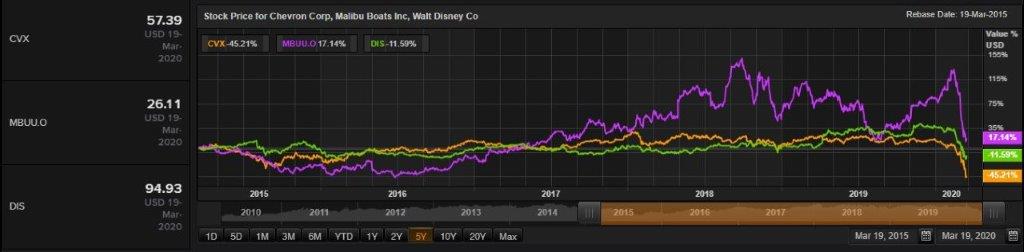
Comparative Price Chart (Source: Thomson Reuters)
Disclaimer
The advice given by Kalkine Canada Advisory Services Inc. and provided on this website is general information only and it does not take into account your investment objectives, financial situation and the particular needs of any particular person. You should therefore consider whether the advice is appropriate to your investment objectives, financial situation and needs before acting upon it. You should seek advice from a financial adviser, stockbroker or other professional (including taxation and legal advice) as necessary before acting on any advice. Not all investments are appropriate for all people. The website www.kalkine.ca is published by Kalkine Canada Advisory Services Inc. The link to our Terms & Conditions has been provided please go through them. On the date of publishing this report (mentioned on the website), employees and/or associates of Kalkine do not hold positions in any of the stocks covered on the website. These stocks can change any time and readers of the reports should not consider these stocks as advice or recommendations later.
 CA
CA  AU
AU UK
UK US
US NZ
NZ Please wait processing your request...