RY 133.2 0.0676% TD 78.025 0.5866% SHOP 96.1 1.2432% CNR 174.72 -0.6595% ENB 45.8 0.5488% CP 115.47 -0.833% BMO 125.17 -0.6035% TRI 210.69 0.114% CNQ 106.31 -0.6727% BN 53.74 0.4298% ATD 75.54 0.5859% CSU 3733.99 2.3092% BNS 64.15 0.1092% CM 64.69 -0.385% SU 52.18 0.5008% TRP 48.36 -0.4938% NGT 52.96 0.5124% WCN 226.28 -0.5319% MFC 31.42 -0.1589% BCE 44.35 -0.4266%

.png)
Stocks’ Details
SYNNEX Corporation
SNX Unveils SYNNEX COLLABSolv to Support Customers in the US & Canada: SYNNEX Corporation (NYSE: SNX) is engaged in offering a wide range of distribution, logistics and integration services to the Information Technology sector. On 13 March 2020, the company unveiled SYNNEX COLLABSolv, which addresses the demand of modern collaboration and the ever-increasing work culture in the U.S. and Canada. This move is aimed to support SYNNEX’s customers and boosts the company’s Technology Solutions business. Notably, the company is set to report its 1QFY20 results on March 24, 2020.
Fourth Quarter of FY19 Key Highlights: During the quarter, SNX reported revenues of $6,581 million, up from $5,544 million reported in the year-ago quarter. Non-GAAP EPS for the period came in at $4.26 per share, up from $3.69 per share reported in the year-ago period. Both top and bottom line increased year over year, due to higher organic revenues along with the successful Convergys business inclusion.SNX’s TechnologySolutions revenues stood at $5.4 billion, an increase of 17.4% year over year. In 4QFY19, non-GAAP operating income stood at $338.5 million, up 26.4% year over year. Also, non-GAAP operating margin stood at 5.14%, up 31 basis points (bps) over the same time span. At the end of the quarter, cash and cash equivalents came in at $225.53 million.
.png)
4HFY19 Key Highlights (Source: Company Reports)
Outlook: For 1QFY20, the company projects revenues in the ambit of $5.24-$5.54 billion. Non-GAAP earnings are expected to be in the range of $3.03 per share to $3.22 per share. Non-GAAP net income is expected to be between $157.3 million to $167.2 million.
Valuation Methodology:P/E Multiple Based Relative Valuation
.png)
P/E Multiple Based Valuation (Source: Thomson Reuters)
Note: All the forecasted figures are taken from Thomson Reuters, NTM: Next Twelve Months
Stock Recommendation: The stock of SNX is quoting at $65.97 with a market capitalization of $3.39 billion. The stock is trading above the average of its 52-week high and low of $70.81 to $52.06, respectively.Going forward, rise in PCs, networking and cloud-based related services is expected to enhance the company’s Technology Solutions business.Considering the aforesaid facts, we have valued the stock using the P/E based relative valuation method. For the purpose, we have taken peers like Arrow Electronics Inc (NYSE: ARW), Tech Data Corp (NASDAQ: TECD), Conduent Inc (NASDAQ: CNDT) and arrived at a target price with lower double-digit upside (in % terms). Hence, we give a ‘Buy’ recommendation on the stock at the closing price of $65.97, down 11.95% as on 18 March 2020.
Square, Inc.
Revenues in 4QFY19 up 51% Year over Year: Square, Inc. (NASDAQ: SQ) is engaged in providing payments solutions via mobile and develops software for point of sale (POS) to streamline operations and analyze business information. On 6March 2020, the company updated the market with 1Q and FY20 outlook to indicate the effect of its $1 billion issuance of aggregate principal amount due 2026. The notes carry an interest rate of 0.125%.
Updated Outlook: For 1QFY20, the company expects net loss per share to be in the range of $0.04 to $0.02, as compared to the previous guidance of $0.03 to $0.01 per share. Adjusted earnings for FY20 are now expected in the range of 88-92 cents per share, down from the previous guidance of 90-94 cents per share. Net loss per share for FY20 is expected to be in the range of $0.15 to 0.11, as compared to the previous guidance of $0.09 to $0.05 per share.
Fourth Quarter of FY19 Key Highlights: SQ reported total net revenue of $1.31 billion, reflecting a rise of 41% on YoY basis. The top line was primarily driven by continuous acceleration in gross payment volume (GPV), which increased 25% year over year. Net income for the period came in at $391 million, as compared to a net loss of $28 million reported in the year-ago period. Adjusted EBITDA for the period came in at $119 million, up from $81 million, reported in the year-ago period. Gross profit for 4QFY19 increased 39% year over year and came in at $527 million.
.png)
4HFY19 Key Highlights (Source: Company Reports)
Outlook: The company anticipated that the total net revenue for the first quarter of FY20 will be between $1,340 million to $1,360 million whilst adjusted EBITDA would fall between $95 million to $100 million. Revenues for FY20 is expected to be in the range of $5.9 billion to $5.96 billion whilst the adjusted EBITDA is expected to be in the range $500 million to $520 million for the same time span.
Valuation Methodology:EV/Sales Multiple Based Relative Valuation
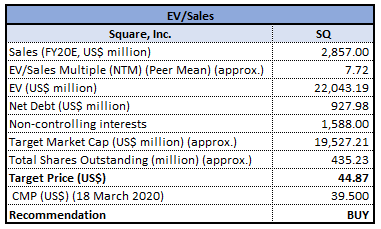
EV/Sales Multiple Based Valuation (Source: Thomson Reuters)
Note: All the forecasted figures are taken from Thomson Reuters, NTM: Next Twelve Months
Stock Recommendation: The stock of SQ is quoting at $39.5 with a market capitalization of $17.2 billion. The stock is trading above the average of its 52-week high and low of $42.08 to $32.33, respectively.The company’s robust impetus across sellers and solid product portfolio is expected to boost financial performance in the near term.Considering the aforesaid facts, we have valued the stock using EV/Sales based relative valuation method. For the purpose, we have taken peers like Mastercard Inc (NYSE: MA), Visa Inc (NYSE: V), and Global Payments Inc (NYSE: GPN), and arrived at a target price with lower double-digit upside (in % terms). Hence, we give a ‘Buy’ recommendation on the stock at the closing price of $39.5, down 11.69% as on 18 March 2020.
WEX Inc.
4QFY19 Financial Highlights for the Period ended 31 December 2019: WEX Inc. (NYSE: WEX) is engaged in providing payment processing and business solutions across a wide range of sectors, which incorporates fleet, travel and healthcare. WEX reported its fourth quarter revenue of ~$440 million, an increase of 15% on year over year basis, on the back of growth across all the three segments. Fourth quarter revenues include a negative impact of $8.7 million from currency exchange rates and lower average fuel prices. Average number of vehicles serviced stood around 14.9 million, an increase of 19% year over year. Revenues from travel and corporate solutions were up 22.7% year over year and came in at $95.7 million.
.png)
Key Highlights (Source: Company Reports)
Updated Outlook: The company recently updated its 1HFY20 revenue outlook, to incorporate the impact of coronavirus outbreak. As a result, WEX now expects first quarter revenue to be ~2% - 3% lower than the previous revenue guidance of $445-$455 million. For FY20, the company expects revenues to be between $1.86-$1.9 billion and adjusted net income is anticipated in the band of $447 million to $464 million in FY20.
Valuation Methodology: EV/Sales Multiple Based Relative Valuation
.png)
EV/Sales Based Relative valuation (Source: Thomson Reuters)
Note: All the forecasted figures are taken from Thomson Reuters, NTM: Next Twelve Months
Stock Recommendation: The stock of WEX closed at $91.77 with a market capitalization of ~$3.98 billion. The stock is currently trading at the lower band of its 52-week trading low and high of $89.48 and $111.38, respectively. Strong demand for the company’s payment processing, account servicing and transaction processing services along with operational efficiency remains a tailwind. Considering the aforesaid facts, current trading levels and business prospects, we have valued the stock using EV/Sales based relative valuation method. For this purpose, we have considered peers like PayPal Holdings Inc (NASDAQ: PYPL), American Express Co (NYSE: AXP), and Square Inc (NYSE: SQ), etc., and arrived at a target price with a lower double-digit upside (in % terms). Hence, we give a ‘Buy’ recommendation on the stock at the closing price of $91.77, down 22.79% as on 18 March 2020, due to the COVID-19 outbreak.
VMware, Inc.
VMW Expands Products & Services Portfolio to Address Customers Need:VMware, Inc. (NYSE: VMW) is one of the top providers of virtualization solutions. The company is engaged in offering virtualization technologies, virtual infrastructure automation along with virtual infrastructure management. Recently, the company announced that it has unveiled a complete portfolio of products and services called VMware Tanzu Portfolio. The latest portfolio helps the company to aid organizations to implement cloud-based technologies and enhance personalized digital experiences. This in turn will bolster VMW’s top line growth.
Fourth Quarter of FY19 Key Highlights: During the quarter, VMW reported revenues of $3.073 billion, which increased 11.4% year over year. The company reported non-GAAP earnings of $2.05 per share, up 9% on a year over year basis. Both top and bottom line increased year over year, on the back of strong performances in NSX and vSAN product lines. During the quarter, revenues from subscription and SaaS soared a whopping 51.7% and came in at $556 million. In 4QFY19, non-GAAP operating income stood at $1.05 billion, up 12% year over year. At the end of 31 January 2020, cash & cash equivalents stood at $2.915 billion, whereas operating cash flow came in at $1.09 billion in the reported quarter. 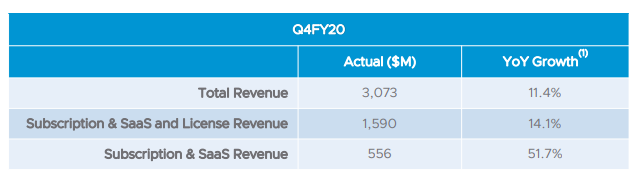
Key Highlights (Source: Company Reports)
Outlook for FY21: For FY21, the company anticipates revenues to be ~$12.050 billion, implying a rise of 11.5% year over year. Subscription & SaaS and License Revenue are likely to be ~$5.860 billion, suggesting an increase of 15.9% year over year. The company expects non-GAAP operating margin to be ~28.8%, while non-GAAP earnings are projected to be ~$6.55 per share. The company expects cash flow from operations to be ~$4.10 billion.
Valuation Methodology: EV/Sales Multiple Based Relative Valuation
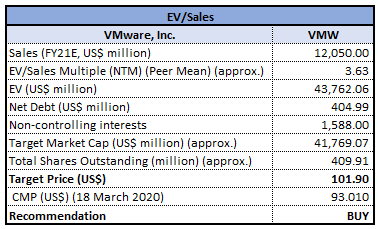
EV/Sales Based Relative valuation (Source: Thomson Reuters)
Note: All the forecasted figures are taken from Thomson Reuters, NTM: Next Twelve Months
Stock Recommendation: The stock of VMW closed at $93.01 with a market capitalization of ~$38.85 billion. The stock is currently trading close to its 52-week high level of $93.56. The company’s continued focus on expanding its product portfolio and new enterprise deal wins are key growth catalysts. Considering the aforesaid facts, current trading levels and business prospects, we have valued the stock using EV/Sales based relative valuation method. For this purpose, we have considered peers like Microsoft Corp (NASDAQ: MSFT), Oracle Corp (NYSE: ORCL), and International Business Machines Corp (NYSE: IBM), to name few, and arrived at a target price with a lower double-digit upside (in % terms). Hence, we give a ‘Buy’ recommendation on the stock at the closing price of $93.01, down 2.95% as on 18 March 2020.
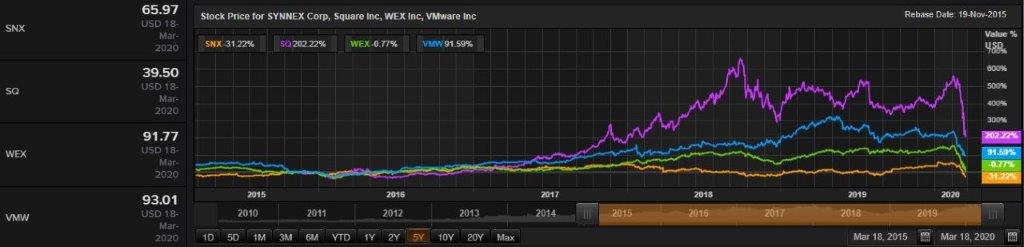
Comparative Price Chart (Source: Thomson Reuters)
Disclaimer
The advice given by Kalkine Canada Advisory Services Inc. and provided on this website is general information only and it does not take into account your investment objectives, financial situation and the particular needs of any particular person. You should therefore consider whether the advice is appropriate to your investment objectives, financial situation and needs before acting upon it. You should seek advice from a financial adviser, stockbroker or other professional (including taxation and legal advice) as necessary before acting on any advice. Not all investments are appropriate for all people. The website www.kalkine.ca is published by Kalkine Canada Advisory Services Inc. The link to our Terms & Conditions has been provided please go through them. On the date of publishing this report (mentioned on the website), employees and/or associates of Kalkine do not hold positions in any of the stocks covered on the website. These stocks can change any time and readers of the reports should not consider these stocks as advice or recommendations later.
 CA
CA  AU
AU UK
UK US
US NZ
NZ Please wait processing your request...