What is Bull Trap?
Generally, traders enter a trade with hopes of appreciation in the stock value. Bull Trap is a deceptive positive growth triggered at the price of a stock. This price is usually above the resistance set based on historical prices. When the stock rises above the resistance, investors get attracted and start parking money into the stock. However, it is a false breakout known as a bull trap. Following a brief rise, the stock begins to crash.
Summary
- Bull Trap is a deceptive short-run positive growth triggered at the price of a stock.
- It's called a trap because it occurs after a strong market rally that appeared to be there to stay.
- Investors may use indicators like moving average, candlestick chart, relative strength index and Moving Average Convergence/ Divergence to judge the presence of a bull trap in the market for a stock.
Frequently Asked Questions (FAQs)
How can a bull trap be avoided?
A bull trap is a reversal against a bullish trend that forces traders to exit their positions as losses mount. It's called a trap because it occurs after a strong market rally that appeared to be there to stay. However, the traders become highly vulnerable when caught off guard.

Stock Market Trader Analyzing Candlestick Graph, image source © Iconicbestiary | Megapixl.com
When a stock breaks out, it is essential not to see the move in isolation. It is a positive sign only if either the economy is on an upward growth path. The economy may be bearish in general, but there may be resilient sectors; if the stock that breaks out belongs to such a sector, it is safe to invest in such a stock. Such trend studies help to build and improve trader confidence.
Also, when a stock breaks out, it is safer to wait and watch for the prices to settle and sustain with justifiable volumes. In addition, being hawk-eyed about the key ratios and conducting technical and fundamental valuation, too, is useful.
A positive trend on the index from which the stock is to be picked is also a good sign to believe that the rally will sustain.
What factors can help decide the sustenance of the rally?
Investors should evaluate multiple indicators before confirming a decision to buy-
A dataset can be taken to track the stock price movements historically. This data can then be used to estimate the moving averages by evaluating averages of smaller subsets of the data. This is a prevalent technical analysis done to study stocks. This method is helpful because it can filter out the random noise in short-run price volatility. This method is helpful to identify the direction of a trend and the extent of resilience. The moving averages may indicate resistance- in case of a positive trend, the moving average value could be indicative of the floor beyond which prices should not tread, while for a downtrend, it would be the ceiling indicator beyond which prices are bound to drop. The lookback period or the time frame for estimating the moving average depends on the trader, but ideally, a 50 day, 100 days and 200-day moving average would be explanatory enough.
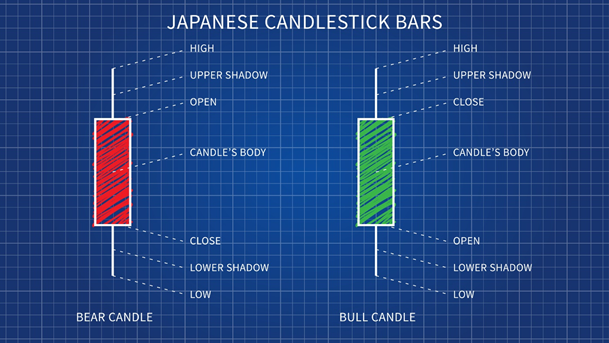
A candlestick is a visual representation of information regarding the price movement of an asset or share. Candlestick charts are one of the most popular types of technical analysis because they allow traders to evaluate price data quickly.

Japanese Candlesticks, image source © Sashaorlangur | Megapixl.com
To understand a candlestick chart, it is essential to understand three elements- the body, the wick and the colour. The body shows the range between the opening and closing price for the trading period. The wick is indicative of the highest and lowest price in the period. The green or red colour is indicative of price increase or decrease, respectively. Once the price crosses above the resistance, checking for commonly used bullish candlestick patterns like the hammer, inverse hammer, bullish engulfing, piercing line, morning star and three white soldiers can be a step before investing further in the stock.
The relative strength index (RSI) is a technical analysis indicator that examines the extent of recent price fluctuations to determine if a stock or other asset is overbought or oversold. The RSI is within a range of 0 to 100. When the RSI rises above 70, it is considered overbought, and when it falls below 30, it is deemed oversold.
The Moving Average Convergence/Divergence (MACD) indicator too is used for technical analysis. On the chart, it appears as two oscillating lines with no limits. The indicator is deemed bullish when the MACD line crosses above the signal line. The indicator is considered bearish when the MACD line crosses below the signal line.
What can one minimise losses due to a bull trap?
When stuck in a bull trap, the primary escape should be to exit the trade at the earliest. The longer the process takes, the more could be the losses. The news has a significant impact on how the market feels about a specific items. Traders might check reports for sudden price fluctuation with average volume before taking any trading actions. One may also place a stop-loss order to minimise their losses and hedge their position. When one notices that a bear trap is in effect, he/she can trade it by opening a short position. Financial derivatives such as spread bets and CFDs can be used to go short. These allow investors to speculate on an asset without owning it outright, making them ideal for shorting.

Image source © Blueximages | Megapixl.com
 Please wait processing your request...