What is Dow Jones Industrial Average?
The Dow Jones Index, also known as Dow, is one of the mainstream stock indices for the United States America. It is the weighted average of share prices 30 actively traded blue-chip stocks which include mostly industrial companies traded on the Nasdaq and the New York stock exchange. It is used as an indicator of how the biggest shares in the U.S. stock market are performing.
The index is also used as an indicative measure of daily movements of company share prices. Apart from industrial stocks, the Dow Jones Industrial Average, or simply put Dow, includes stocks from other sectors of the market too, including information technology, entertainment, and financial services.

Image Source: Djbobus | Megapixl.com
How are companies selected to be included in the Dow?
The 30 companies that are included in the calculation of the index are the largest companies listed on the American stock exchanges. This makes the Dow a more accurate representation of the market flow.
The decision is made by a committee of representatives from the S&P 500, Dow Jones Indices and the Wall Street Journal. This committee has the final say on the index composition. Evaluation is done based on the capacity of a company to carry out further growth as well as the on the company’s reputation in the market.
Which companies are included in the Dow Jones Industrial Average?
The following companies are included in the Dow as on March 16, 2021:
- 3M (MMM)
- American Express (AXP)
- Amgen (AMGN)
- Apple Inc. (AAPL)
- Boeing (BA)
- Caterpillar (CAT)
- Chevron (CVX)
- Cisco Systems (CSCO)
- The Coca-Cola Company (KO)
- Down Inc. (DOW)
- Goldman Sachs (GS)
- The Home Depot (HD)
- Honeywell (HON)
- IBM (IBM)
- Intel (INTC)
- Johnson & Johnson (JNJ)
- JPMorgan Chase (JPM)
- McDonald’s (MCD)
- Merck &Co. (MRK)
- Microsoft (MSFT)
- NIKE (NKE)
- Proctor & Gamble (PG)
- Salesforce (CRM)
- The Travelers Companies (TRV)
- United Health Group (UNH)
- Verizon (VZ)
- Visa (V)
- Walmart (WMT)
- Walgreens Boots Alliance (WBA)
- The Walt Disney Company (DIS)
How was the Dow developed?
The index was started in 1896 and was developed by Charles H. Dow and Edward Jones with only 12 companies being included in the index at the time. Later this number was increased to 20 in 1916 and by 1928, the stock was amped up to include 30 companies, a figure which is still followed. It is the second oldest U.S. market index and has seen various additions and subtractions of companies over the years.
The index was made with the intent of easing the hassle of going through newspapers, journals and hearsay which is a lengthy process. Additionally, processing such large amounts of information individually was not feasible.
Thus, Dow and Jones developed the “Dow” to better understand market function and assess how the markets were moving, i.e., upwards, or downwards. This would simplify the market trends for a layman on any given day.
What were the initial set of companies included in the Dow?
The following were the 12 companies with which the Dow calculation had started:
- American Cotton Oil Company
- American Sugar Company
- American Tobacco Company
- Chicago Gas Company
- Distilling and Cattle Feeding Company
- Generic Electric
- Laclede Gas Company
- National Lead Company
- North American Utility Company
- Tennessee Coal and Iron
- S. Leather Company
- S. Rubber Company
All these companies had been the best performers of the time and had been highly traded.
How did the company composition in the index change over the years?
During late 1990s, the focus of the index was shifted towards tech stocks. Several tech-based entrants were observed during the period including Microsoft, Intel and Hewlett-Packard. In 2004, various blue-chip players were removed including Eastman Kodak, International Paper and AT&T which led to a shock in the index.
In 2018, General Electric, one of the companies that had stuck around since the beginning of the index was dropped from it. This was done to include Walgreens Boost Alliance into the composition. However, since then Walgreens has not been able to fetch profits to its investors with dismal stock market performance.
Currently, the composition of the index has changed dramatically from what it was before. In 2020, 3 new companies were added to the composition, namely, Salesforce, Amgen and Honeywell. However, each addition must be accompanied by a corresponding deletion of stocks from the index.
This was followed by the removal of Exxon Mobil, Pfizer and Raytheon Technologies. Out of these, Raytheon and Exxon had been long-running components of the index. These had been a part of the index even before World War II. This shift towards more software-oriented platforms was a sign of evolving trends in the market.
Why is the Dow important?
The Dow has long been used as a signal indicating stock market weakness or strength. The market trends have been observed to coincide with the direction that Dow takes. For instance, if a few industrial stocks are down, then the Dow would also show a decline making it a strong representative index for the entire market.
Globally, many investors and stock market experts rely heavily on the Dow to assess the situation in U.S. as well as in the rest of the world. The 30 companies listed in the index are premier institutions with the faith of investors instilled in them.
How is the Dow calculated?
Initially the index was calculated by taking the price of one share of each of the listed stocks in the index, adding them all together and taking a simple average to arrive at the Dow Jones Industrial Average. However, with time the method to calculate the index has changed substantially.
The current formula is slightly more complicated as it involves a weighted average of all the stocks rather than a simple average. The weights are dependent upon the price of the stocks in the market meaning more expensive stocks would hold greater weightage than cheaper ones. The index accounts for the differences in the prices of different stock shares and is adjusted for the same. The largest and most stable companies act as a good proxy for the entire market’s performance.
The formula also adjusts for companies that are added or removed and for stock splits as well. Stock splits occur when companies double the number of its stocks and sell each stock for half of its previous price.

Image Source: Kgtoh | Megapixl.com
How is Dow Jones different from other indices?
The Dow is one of the three major stock market indices used to tap market strength. The S&P 500, which tracks the performance of the 500 largest US companies listed on the exchanges, is another prominent index.
The S&P 500 index came after almost 60 years in 1957 and was introduced by Standard & Poor’s. The S&P 500 holds weights that are proportionate to market value and not to the market price as is the case seen with the Dow Jones Industrial Average. The S&P index is a much broader index of the market than the Dow.
Another index called the Nasdaq composite is a famous index used by investors to keep a watch on the market. This index, however, includes all the stocks listed on the Nasdaq exchange to calculate the index. These mostly include tech companies as Nasdaq exchange predominantly holds tech-oriented firms on the platform.
The tech-heavy Nasdaq index is more volatile than the remaining two indices as it includes many small but high-growth stocks.
What are the shortcomings of the Dow Jones index?
Under the Dow, the weights arise from the price of the shares in the market. This price-based weightage means that more expensive stocks would get higher weightage than those stocks which are not as expensive.
Consider a stock priced at USD 50, and another stock priced at USD 10. The former would get 5 times the weightage given to the latter. This type of a system ignores other aspects of a company like its market capitalization.
Similarly, in the case of stock splits, a company’s share price would drastically reduce to half of what it previously was. This would have a huge impact on the weightage given to the stock in the Dow Jones index calculation.
As a solution to this problem, the divisor of the index is frequently adjusted for instances like stock splits and special dividends. Additionally, some investors use S&P 500, which assigns weights to companies based on their market capitalization and not price.
What is the Dow theory?
The Dow theory was also developed by Charles Dow. It states that the market shows an upward trend if one of its averages exceeds a previous bar marked as an important high level. This is followed by a similar high in another average.
Consider the case of rising Dow Jones Industrial Average which exceeds a previous high, in such a case another index would also follow.
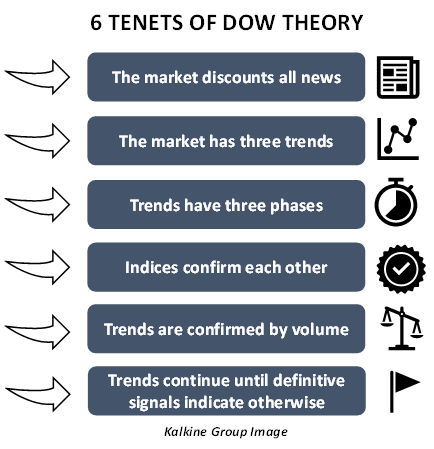
The Dow theory is extensively used in technical analysis. There are 6 tenets of Dow theory:
- The market discounts all news: Any information available in the market is already reflecting in the prices of the stocks and in the indices.
- The market has three trends: The market moves in the following three trends:
- Primary Trend- This is the major trend in which the market moves. A primary trend could continue over years and in long phases.
- Secondary Trends- These trends reflect corrections in the primary trends. In that sense they move in the opposite direction of the primary trend. However, the difference here is that these trends are not carried over long phases as is the case with primary trends.
- Minor Trends- These refer to the fluctuations that occur daily. The timeline for minor trends is less that 3 weeks, however, they work in the opposite direction of the secondary trends. In essence they might sometimes go hand in hand with the overall market movements.
- Trends have three phases: This tenet states that primary trends have three phases, namely, accumulation phase, public participation, and panic phase.
- Indices confirm each other: All indices are reflective of the overall trend. One index should not be moving in a direction opposite to all the others.
- Trends are confirmed by volume: The trading volumes must support the existing trend in the market. For example, in an upward trend, volume rises as prices increase and falls as prices decrease.
- Trends continue until definitive signals indicate otherwise: The market trends would continue to exist even without any noise in the market.

What is ETF investing?
ETF investing allows investors to invest in Indices such as Dow Jones through an Exchange Traded Fund which closely track the performance of the Dow Jones index. An ETF is an investment fund trading on a stock exchange that follows benchmark indices. This can be understood as a stock that is made up of a collection of shares of different companies.
One such example of an ETF linked to the Dow Jones index is SPDR Dow Jones Industrial Average ETF. This ETF makes investments in all companies listed on the Dow. Investing in ETFs is the only way to invest into Dow Jones because there is no other method allowing investments in an index.
 Please wait processing your request...