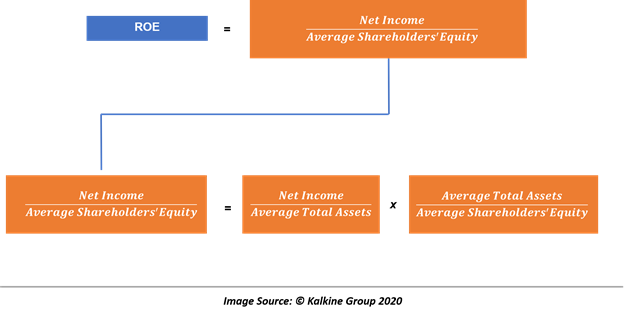
DuPont analysis, named after the Company that designed the method (DuPont Corporation), measures how the Return on Equity (ROE) acts as a function of its efficiency, operating profitability, taxes, and use of leverage. It is an investment process that involves breaking and expressing the ROE as the product of its component ratios.
Good read: Interpreting ROE: A Quick look at Dupont Analysis
As each component ratio of ROE represent a distinct aspect of a company’s performance, decomposition allows analysts to evaluate how different aspects of ROE or performance impacts a company’s profitability as measured by ROE.
Moreover, breaking up of ROE allows analysts to study and uncover the reasons for the change in ROE over time as well as in the cross-sectional setting.
While there are many forms of ROE decomposition followed by the investors, the most widely accepted method is as below:

The above decomposition could be interpreted as
ROE = ROA * Leverage
Thus, one can say that the return-on-equity is a function of a company’s return-on-assets and its leverage.
Therefore, a company can improve its profitability or ROE by improving its ROA or making efficient use of its financial leverage.
How To Define An Efficient Use of Leverage?
Ideally, if a company has no leverage, its financial leverage ratio, i.e., average total assets divided by average shareholder’s equity would be 1.0; however, as a company piles on debt, its financial leverage increases.
But if a company can borrow the capital for its operations at an interest rate lower than the marginal rate, it can imply that the company is using its leverage efficiently.
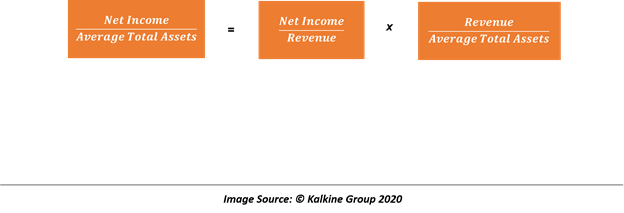
Just as ROE could be broken down as a function of a company’s ROA and financial leverage, ROA could be further broken down as shown below:
Break 2

ROA could be represented as,
ROA = Net Profit Margin * Total Assets Turnover
Thus, post considering the breakup of ROA, the initial equation of ROE, i.e., ROE = ROA * Leverage could be expressed as
ROE = Net Profit Margin * Total Assets Turnover * Leverage
Therefore, we could say that a company’s ROE is a function of its net profit margin, which identifies how much income a company derives per monetary unit of sales, total assets turnover, and the financial leverage.
Five-Way Decomposition
Break 3
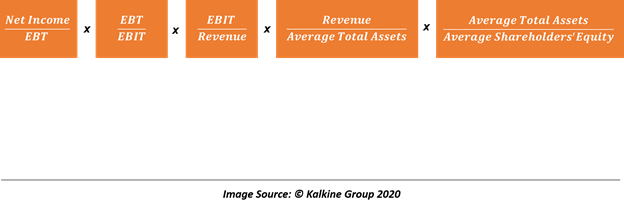
Furthermore, to separate the effects of taxes and interest, the ROE could be further decomposed as below:

Thus, ROE could be represented as a function of tax, interest, EBIT, total assets turnover, and leverage.
The above decomposition of ROE is known as the five-way decomposition and is widely used.
Interpretation of Five Way ROE Decomposition
Part 1
The first component of the above equation, i.e., Net income by EBT represents the effect of taxes on a company’s ROE and is basically one minus the average tax rate, which reflects how much profit a company gets to keep before tax.
Part 2
The second term of the equation, i.e., EBT by EBIT captures the effect of interest on a company’s profitability or on its ROE. Ideally, a higher borrowing cost reduces the ROE.
Some financial analysts tend to use the operating income to replace EBIT in the above equation, and in such a case, the EBT by operating income captures the effect of interest and non-operating income on a company’s profitability or ROE.
While the replacement of EBIT with operating income is common among the financial community, it does not disturb the interpretation of the equation if used consistently, i.e., in the numerator of the third portion of the above equation.
Part 3
The third term of the five-way decomposition, i.e., EBIT by Revenue captures the effect of a company’s EBIT margin on its profitability or the effect of its operating income on ROE (if EBIT is replaced by operating income).
However, whether an analyst uses operating income or EBIT, the third component essentially captures the effect of operating profitability of a company on its ROE.
Part 4
The fourth component of the equation, i.e., Revenue by Average Total Assets is the total assets turnover ratio that reflects a company’s overall efficiency in generating revenue per unit of total assets.
Part 5
The fifth component of the five-way decomposition of ROE, i.e., Average Total Assets by Average Shareholder’s Equity represents the financial leverage of a company.
Ideally, higher the financial leverage used by a company, i.e., higher its debt or fixed obligations, the less profitable would be the company.
Limitations of DuPont Analysis
One of the biggest drawbacks of DuPont Analysis is its reliance on accounting numbers and financial figures which could be manipulated by using different techniques of financial reporting. Thus, on a standalone basis, DuPont analysis only tells that a particular component of ROE is either high or low without reflecting upon the potential reason behind the same.
Therefore, the use of DuPont analysis is limited to study the companies within the same industry because in a cross-sectional setting (industry-wise) it often fails to capture the compatibility of companies belonging to different industries.
 Please wait processing your request...