What are Key Ratios?
Creditors, investors, and managers, in particular, can determine a company's financial position by defining and estimating key financial ratios. The stakeholders can use numbers from the financial statements to perform various calculations. However, some are less significant than others. Financial experts have discovered leading indicators of a company's operating success in main market fields: liquidity, activity, leverage, cash flow, profitability, and cash flows.
Some key ratios to assess the financial health of a firm can be broadly classified as indicated below-

Copyright © 2021 Kalkine Media
Summary
- Key Ratios are used for the financial analysis of the firms.
- Stakeholders can assess the liquidity, Efficiency, Profitability and Market Value of a firm with the help of these ratios.
- Liquidity ratios are used to judge a company’s ability to pay off its short term debts.
- Activity Financial Ratios or Efficiency Ratios are used to assess the efficiency with which a firm's assets and other resources are utilised.
- Profitability Ratios assess efficiency in the core operations of the firm.
- Market Value ratios are used to assess a company’s shares.
Frequently Asked Questions
What are the Liquidity Ratios?
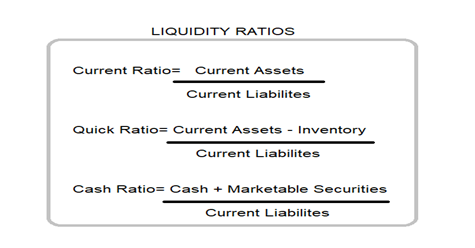
Liquidity ratios are used to judge a company’s ability to pay off its short term debts. Using liquidity ratios, we can determine if the company’s current assets or liquid assets are enough for this purpose. Commonly used liquidity ratios are current ratio, quick ratio and cash ratio.
Copyright © 2021 Kalkine Media
The current ratio is the ratio of a firm’s current assets to its current liabilities. It may be noted that current assets are comprised of cash, accounts receivables and inventory of the firm. Current ratio less than one implies that the short term liabilities are more than the assets that it can turn to cash- this indicates liquidity risk; a value of 1 means just enough cash to pay off short term debts. It is ideal for maintaining a ratio of two or more to minimise liquidity risk. However, there is a trade-off between minimising liquidity risk and blocking more cash in networking capital, which is the excess of current assets over current liabilities. Too high a current ratio is indicative of a firm struggling to clear its inventory. The quick ratio, also known as the acid test ratio, considers only the quick assets- current assets that instantly convert to cash, i.e. marketable securities and liquid cash. The consideration for accounts receivable is specific to the ease of cash convertibility in each case. When firms consider only cash and marketable securities, it is called the cash ratio.
What are the Turnover Ratios and Activity Ratios?
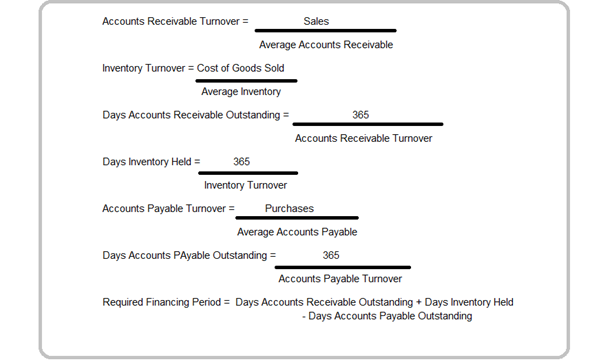
Turnover Ratios assess the efficiency of working capital management. It measures how fast firms turn accounts receivables to cash or inventory to sales. The more the required financing period of the firm, the higher is the short term liquidity risk.
Copyright © 2021 Kalkine Media
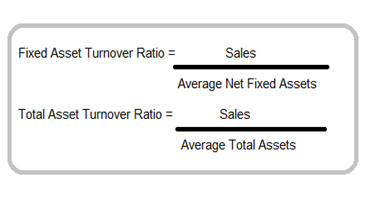
Activity Financial Ratios or Efficiency Ratios are used to assess the efficiency with which a firm’s assets and other resources are utilised. Asset Turnover Ratio measures the ability of a firm to generate sales from its assets, while the inventory turnover ratio measures the number of times inventory is sold and restocked. Fixed Asset Turnover Ratio measures the efficiency with which a company's fixed assets are used. Fixed assets are tangible, long term and these are not used in daily operations.
Examples of fixed assets include vehicles, land and buildings and plant and machinery. A high ratio indicates the company's need to invest more in capital expenditure, and a low ratio implies that too much capital is blocked in fixed assets. Total Asset Turnover Ratio is the measure of efficient usage of the total assets. Total assets included current assets and long term assets. A very high ratio indicative of low assets and a low ratio indicates inefficient utilisation of the fixed assets.
Copyright © 2021 Kalkine Media
What are the Profitability Ratios?
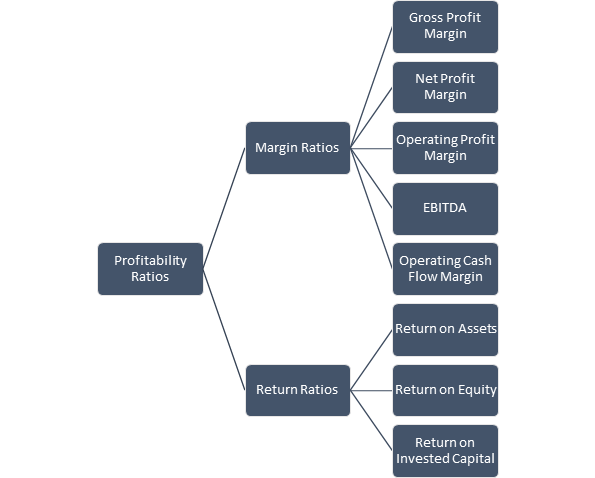
The main profitability ratios used for financial analysis of a company as further classified into margin ratios and return ratios as explained below:-
Copyright © 2021 Kalkine Media
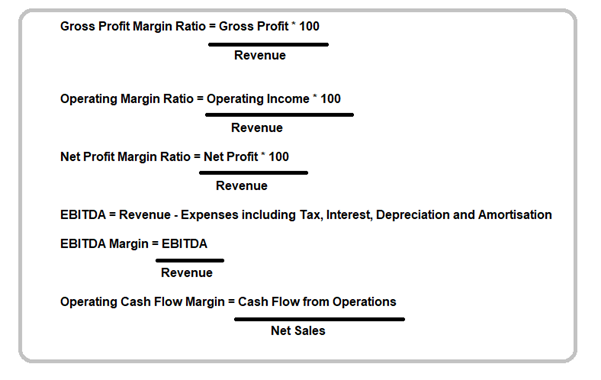
Gross profit is the profit left over after selling a product or service and deducting the cost of production and sales. It is used to analyse the firm's efficiency in the usage of raw materials, labour and other resources used in production.
The gross profit margin ratio is used to assess efficiency in core operations, i.e. the firm's ability to provide earnings to the firm even after paying up operation expenses, depreciation, dividend, cost of borrowing etc.
Operating margin also referred to as return on sales, shows much of revenue generated from sales remains after the operating expenses of a business. A strong operating margin creates value for shareholders, and the higher the margin lesser the financial risk. Operating margins may improve through cost control or revenue inducing higher pricing, marketing and increased demand. When operating profit margins are high, companies are better equipped to pay for fixed costs and finance their debts. It can also explore the possibility of offering prices lower than its competitors.
Net profit margin is used to assess the proportion of total profit from the firm's total revenue. An excellent net profit margin is indicative of a firm's probable net worth based on its earnings. It tells us for every dollar of goods sold how many cents are generated as profit. A high net profit margin can help a firm wade through bearish market periods. Reducing overhead costs and improving sales volumes can help enhance the net profit margin.
In financial modelling, EBITDA is commonly used as a starting point for estimating free cash flow. When comparing two companies, the Enterprise Value/EBITDA ratio can be used to give investors a general idea of whether a company is overvalued (high ratio) or undervalued (low ratio). Thus, EBITDA is important to compare companies that are similar. The EBITDA metric is often used as a cash flow proxy. When a business is not profitable, investors may use EBITDA to assess the company. Business owners use it to compare their results to that of their rivals.
The operating cash flow margin is a profitability ratio that calculates the amount of cash generated by a company's operating operations as a percentage of net sales over a given time. It calculates the percentage of sales revenue that is operational cash. It demonstrates how effectively an organisation generates profit from its sales. Operating cash flow margin is also a measure of profitability. Operating cash is the money a company makes after subtracting expenses associated with long-term investments, such as capital items and shares
Copyright © 2021 Kalkine Media
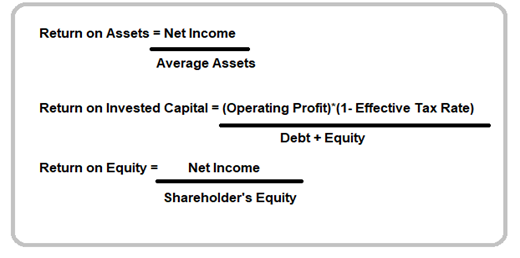
Return on assets (ROA) is a form of return on investment (ROI) metric that compares a company's profitability to its total assets. This ratio compares a company's profit (net income) to the money it has invested in assets to determine how well it is doing. The higher the return, the more effective and successful management is in using financial capital.
The return on invested capital (ROIC) is a metric that measures a company's efficiency in allocating its capital to productive investments. The return on invested capital (ROIC) ratio indicates how effectively a business uses its capital to produce income.
When a company's return on invested capital (ROIC) is compared to its weighted average cost of capital (WACC), it can be determined whether or not invested capital is being used efficiently. The term "return on capital" is often used to describe this metric.
The return on invested capital (ROIC) is a metric that measures a company's efficiency in allocating its capital to productive investments. The return on invested capital (ROIC) ratio indicates how effectively a business uses its capital to produce income.
The term "return on equity" refers to the ratio of net income or benefit to shareholders' equity. The overall return on equity capital is a measure of a company's ability to transform equity assets into income. To put it another way, it calculates how much profit each dollar of shareholders' equity generates.
Copyright © 2021 Kalkine Media
What is Market Value Ratios?
Market value ratios as used to assess the shares of a company. Commonly used market value ratios are explained as follows-
Copyright © 2021 Kalkine Media
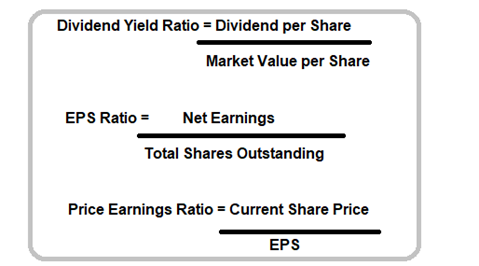
The dividend yield ratio shows how much a firm pays out in dividends to its stockholders per year as a percentage of the stock's market price. The annual dividend per share is divided by the market value per share to arrive at this figure. The ratio is also referred to as dividend yield percentage because it is expressed in percentage form. Since the dividend yield ratio is used to calculate the relationship between the annual sum of dividend per share and the stock's current market price, it is primarily used by investors searching for consistent dividend income.
The earnings per share (EPS) ratio calculates how much net income per share of common stock received over a given period. It is a common metric for determining a company's overall profitability. Values associated with preference shares are excluded from the estimation of the EPS ratio. The EPS figure is highly significant to current and prospective common stockholders because dividends and possible increases in stock value are primarily dependent on the company's earning power. Analysts, stockholders, and potential investors all use and depend on earnings per share (EPS). In certain nations, public corporations must disclose this number on their income statements by law. The higher the earnings per share (EPS) percentage, the better. A higher EPS indicates higher profits, a better financial position, and a trustworthy business to invest in. EPS should be observed over the years and not just for a single year to better review the firm.
Price to Earnings Ratio (P/E Ratio) The ratio of a company's current share price to its earnings per share is called a ratio (EPS). For calculating this ratio, analysts and investors can use earnings from various periods; however, the most widely used variable is a company's earnings from the previous 12 months or one year. The Forward P/E Ratio is determined by dividing the price of a single unit of a company's stock by the company's expected earnings generated from future earnings guidance. It's also known as an expected P/E Ratio because it's dependent on a company's projected earnings. The trailing P/E ratio considers a company's past earnings over some time. It gives a more objective and realistic picture of a company's success.
 Please wait processing your request...