What is the law of supply?
The law of supply states that keeping other parameters constant, as the prices of a commodity increase, the supply of that commodity also increases. This means that ceteris paribus, price changes move in the same direction as a commodity’s supplied quantity.
Law of supply, along with the law of demand, helps explain how goods and prices are allocated in a market. Law of supply has been made from the producer’s standpoint while the law of demand has been made from the consumer's perspective. Together, both of these laws help determine the goods market equilibrium.
What is the supply curve?
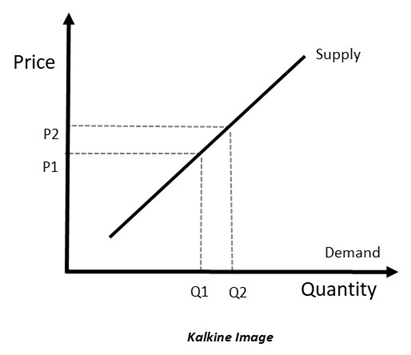
A supply curve signifies the relationship between the price of a good and the quantity supplied. The slope of a supply curve is always positive because of the Law of Supply. This happens because as prices of a good increase, the firms focus more on producing that good to earn higher profits.
A graphical depiction of a supply schedule is called a supply curve. A supply schedule is a tabular representation of various price level and the quantities of the commodity supplied at those prices.
The variation in the slopes depends on the price elasticity of supply of a good. As the price elasticity of supply increases, the slope of the supply curve decreases.

In the diagram above, as the price of a commodity increases from P1 to P2, the quantity supplied also increases from Q1 to Q2. This positive relationship is explained through the law of supply.
Why is there a positive relationship between the price of a good and the quantity supplied?
The producers, like consumers, are rational beings and would like to save up on their costs. As the quantity demanded of a is good increased, the firms must produce more to satisfy the rising demand. This increase in production leads to business expansion, which means greater costs for the firm.
The business expansion involves costs like the addition of new labour force, new machinery, maybe setting up new factories etc. Thus, they start to charge more for each commodity, as the supply is increased in an economy. This relationship is explained under the assumption that all other factors affecting supply are kept constant.
Conversely, it can be argued that as the prices of goods rise in the economy, the demand falls because of the law of demand. Thus, some demand may still go unsatisfied if prices become too high.
How is equilibrium explained through the laws of demand and supply?
The price of a good adjusts according to the demand and supply in the economy. If there is excess demand for a good, it means that there is not enough production to meet the consumer’s demand. Consequently, producers could either increase the prices so that demand reduces, or improve their production, which could also lead to higher prices.
Alternatively, when there is a shortage of demand in the economy, firms would be compelled to lower prices and encourage consumers’ spending. They could also reduce supply by temporarily shutting down production; however, that seems like the costlier alternative.
Therefore, the conditions of excess supply and excess demand can both be brought to equilibrium by appropriate changes in the commodity’s price. Thus, the law of demand and supply collaboratively decide the market equilibrium and can influence the economy’s production levels.
How does the supply of a good change?
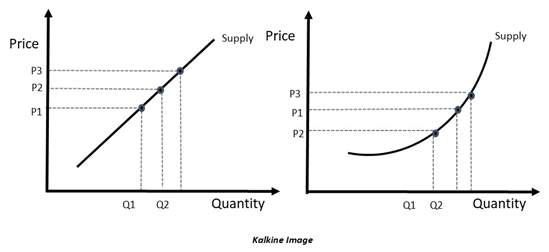
Keeping all other factors equal, the supply of goods may change because of prices or many other factors. When the supply changes because of a change in prices, the changes are observed along the curve.
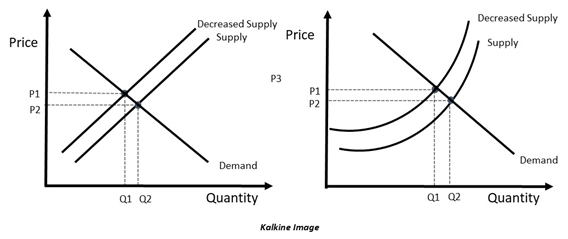
However, the supply curve may shift when any factor, other than the price, is changed one at a time. These factors are income, technology, the cost of production, the scale of production, prices of related goods and government policies.
When either of these determinants is changed, keeping the others constant, the demand curve would change by shifting rather than through a movement along the curve.
The following diagram represents the movement along the curve:

Here the price and quantity allocations shift along the curve. However, when factors other than the price change, a shift in the demand curve is observed, which can be shown as:

Are there any exceptions to the law?
The backward bending supply curve of labour is one prominent example of an exception to the law of supply. The supply curve of labour follows the law of supply but only up to a certain extent. It starts bending backwards, defying the law of supply after a point.
The law of supply applies to labour as they offer a higher number of hours worked against higher wages. However, this only continues till the labour becomes wealthy enough not to find higher wages incentivising enough to work more. Therefore, beyond a point, the workforce may not offer as much labour as before and spend more time doing leisure than doing work.
Another important scenario is when the supply of a good is fixed. In such a case, even if there is excess demand in the economy, the producers cannot meet it due to limited supply. Therefore, they only have the option of waiting it out. This can be done by increasing prices. It is important to note, that even when supply is fixed, the prices rise and thus, the law of supply does not follow here.
 Please wait processing your request...