Market breadth is as an indicator used to gauge the internal strength of the market. This indicator analyses the relative number of advancing stocks to the number of declining stocks, within an index, on a given trading session.

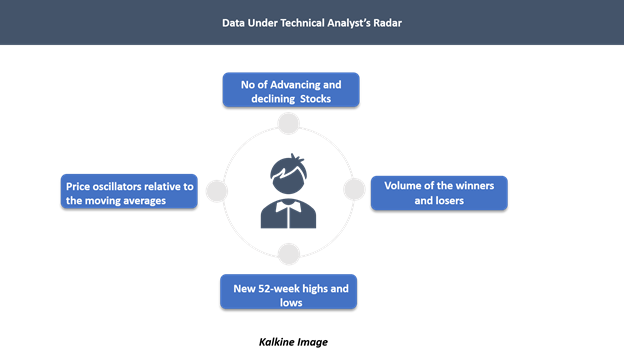
In addition to measuring market sentiment through varies techniques like “trend analysis”, technical analysts usually look at the internal strength of a market by analysing various data such as the number of stocks advancing and declining, the volume of the winners and losers, the new 52-week highs and lows, and the position of price oscillators relative to the moving averages.
On any given day, a stock can do only three things as compared to its previous close, i.e., it can either close higher, lower, or unchanged against its previous close, and when the next day’s close in a particular stock is higher than its previous day’s close, it is known as advancement or advance.
Likewise, if the next day’s close in a particular stock is lower against the previous close, it is known as decline.
Advance/ decline data is called the breadth of the stock market, which measures the internal strength of the stock market.
The market breadth can be used in three major ways for internal strength analysis.
- The cumulative breadth line or the advance-decline line.
- The advance-decline ratio.
- The breadth difference.
The Cumulative Breadth Line or the Advance-Decline Line
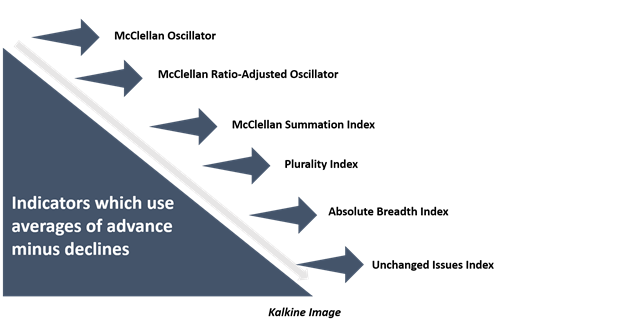
It is one of the most common and probably the best ways to gauge the breadth and measure internal strength. The line is ideally the cumulative sum of advance minus declines.

On sessions, when the number of advancing stocks is higher against the number of declining stocks, the breadth line rises and vice versa.
Also, a cumulative breadth line can be constructed on any index, industry group, exchange, or a portfolio, on any timeframe, i.e., daily, weekly, monthly, and so on.
Interpretation of the cumulative breadth line
Ideally, the plot of the breadth should replicate the stock market averages or averages of any index or study group under consideration.
The importance of breadth line emerges in times of market divergence, i.e., when stock market averages rise, and the market breadth line falls. If the market is rallying and the market breadth line is not, it implies that the majority of stock are either not participating in the rally or declining in value.
However, novice traders should be familiar with the fact that many of the freely available market breadth data provided by various exchanges might include the impact of the proliferation of nonoperating company listings or inclusion of structured products such as ETFs, bond funds, preferred shares, depositary receipts into an index, which are not directly associated with the economic activity.
Thus, many technical analysis tools and technical analysts often use breadth line of common stocks, exclusively. Many technicians also prefer to customise their own breadth lines to gauge the internal strength of the market.
The Advance-Decline Ratio
The advance-decline ratio is another way of interpreting the breadth line and is also known as an oscillator of the market breadth.
Ideally, post capturing the advance and decline data of an index or any study group of interest, technicians usually divide the number of advancing shares with the number of declining share to derive a ratio or a numeric value, which is then compared to the normal ratio value, which is typically one.
The interpretation of the ratio oscillator is quite simple; the higher the ratio, the higher would be the number of advancing shares in the underlying index.
Interpretation of the Advance-Decline Ratio
On any given day, advance/decline ratio of 1 indicates an equal number of advancing and declining shares. Likewise, a ratio lower than 1 denotes higher declining stocks relative to advancing stocks and vice versa.
Also, many technical software allow technicians to plot the ratio value historically to give a line graph, which can be used to compare the historical peak in the ratio with a past peak in the index, and spot divergence, if any, or for confirmation.
The Breadth Difference
Breadth difference is typically defined as the net of advances minus declines, either with the resulting sign or with an absolute number. Historically, this measure has been quite successful in capturing the internal strength of the market; however, with the increasing number of listed shares, calculating market breadth has become quite troublesome.
Additionally, more issues mean larger potential breadth difference, which makes it quite unsuitable for comparing historical trend, as new issues potentially increase the magnitude of a change in the breadth difference.
Thus, it becomes imperative for indicators using the breadth difference to periodically adjust for the increase in issues traded.
 Techniques to Implement Market Breadth Measures
Over the last years with the advancement of systematic trading and computational power, technicians across the globe have developed various ways to use the market breadth information for spotting profitable trades.
One of the simplest and widely-used ways is to compare the advance-decline line to its own moving average to generate buy and sell signals.
Historically, many research group and various consortium of technicians have used multivariant averages to generate trading signals. Ned Davis Research group used the NYSE advance-decline line to its 32-week simple moving average, which demonstrated some strong results
While market breadth methods are one effective way to capture the internal strength of a trend, another tool which is very significant when used with market breadth indicators is the volume.
To Know How, Do Read: Volume Analysis- How to Utilise the Secondary Tool To Generate Alpha?
There are plenty of technical indicators that integrate market breadth and volume to measure the internal strength of the market, “Arms Index” is one of the popular ones.
The Arms Index
The arms index is defined as the ratio of two ratios, as below:

If the absolute number of advancing shares increases on low volume, it would lead to a rise in the ratio, which would further reflect that, although the number of shares advancing on a day is large, the market is not strong because of relatively low volumes to support the price.
 Please wait processing your request...