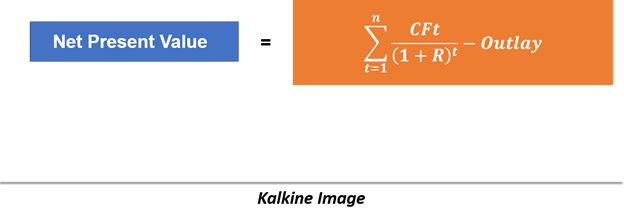
Net Present Value (or NPV) is defined as the sum of the present value of all future cash flows (negative or positive) discounted at a required rate of return of a project.
It could also be defined as the difference between the present value of future cash inflows discounted at a required rate of return and the present value of the initial cash outflow.
NPV is one of the most important tools used in capital budgeting and investment decisions and assists in analysing the profitability of a projected investment or series of cash inflows from a project.
To understand the concept of NPV, one has to keep one thing in mind that the money has a time value, i.e., a $100 received today is more in value as compared to a $100 received a year later.
Why that so?
A $100 bill received today could be invested to generate a return for a year as compared to a $100 bill received a year later. Suppose you have the choice of receiving $100 today or $105 a year later.
What would you choose?
Well, the answer to that lies in the time value of money and the opportunity cost.
An opportunity cost is what a resource is worth in its next best use or could also be defined as a return forgone for choosing an alternative.
Coming back to over example, suppose if the current return on saving accounts is 10 per cent per annum (10% p.a.). The ideal choice would be to accept a $100 bill today, as you can invest that $100 in your saving accounts, which would generate an extra $10 for you in a year.
With that, the year-end value of your $100 would be $110.
However, if a person chose to take $105 a year later than $100 today, the opportunity to earn 10 per cent is forgone, which would become the opportunity cost in this scenario.
Time Value of Money
Money has a time value in that individuals value a given amount of money more highly the earlier it is received due to that fact that a smaller amount received today may be equivalent in value to a larger amount received at a future date.
The time value of money as a concept primarily deals with equivalence relationships between different cash flows across different horizon of time.

Where
R = Required rate of return
N = Number of periods
Once we are familiar with the time value of money and could comfortably discount cash flows, it becomes very easy to calculate the NPV of a series of projected cash flows.
Net Present Value and The Investment Decision Criteria
Analysts use several important criteria to evaluate capital investments, in which NPV is the most comprehensive measure to determine whether a project is profitable or not.

Where
CFt = After-tax cash flow at time t
R = Required rate of return
Outlay = Investment cash flow at time zero
To illustrate the NPV calculation and investment decision, we would work our way through an example;
Assume a Company A is considering an investment of $50 million in a capital project/ capital good that will return after-tax cash flow of $16 million a year for the next four year along with an additional $20 million at the end of the fifth year, i.e., year 5.
Furthermore, suppose the required rate of return on the project is 10 per cent.
The NPV for the above case would be as below:

I.e., $13.136 million.
The investment of $50 million has a total value, or present value of future cash flows, of $63.136 million.
The investment decision criteria around NPV is relatively simple, i.e.,
Invest if NPV > 0
Do not invest if NPV < 0
In other words, a positive NPV investment is wealth-increasing in nature and vice versa.
NPV Profile
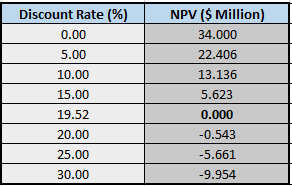
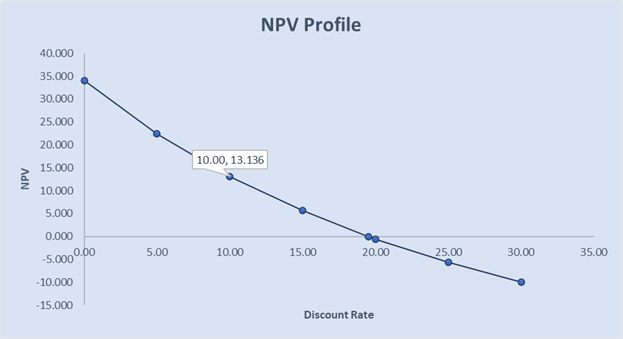
NPV profile is a related concept to NPV that shows a project’s NPV graphed as a function of various discount rates.
The NPV profile for the above Company A example is as below:

when we plot the above NPV profile on a graph, we get three interesting points, i.e., where the profile goes through the vertical axis (the NPV when the discount rate is zero), where the profile goes through the horizontal axis (where the discount rate is the IRR), and the NPV for the required rate of return – in our example, NPV is $13.136 million when the discount rate is 10 per cent.

Kalkine Image
The NPV profile of the above example is relatively simple, where the NPV declines at a decreasing rate as the discount rate increases. The profile looks convex from the origin (or convex from below).
Ranking Conflicts Between NPV and IRR
For a single conventional project, the NPV and IRR would agree on the investment decision, and for independent conventional projects, no conflict between the decision rules for the NPV and IRR.
However, in the case of two mutually exclusive projects, the most widely used investment decision criteria, i.e., NPV and IRR would sometimes differ.
For example, if one has to choose between two projects says A and B, where Project A might have higher NPV as compared to the Project B and Project B might have a higher IRR as compared to the Project B.
This happens as differing cash flow patterns can cause two projects to rank differently with the NPV and IRR.
So, whenever, the NPV and IRR rank two mutually exclusive projects (i.e., either Project A or Project B) differently, the investment decision making suggests giving NPV a higher preference, i.e., in such a case the decision-maker should choose the Project A over the Project B.
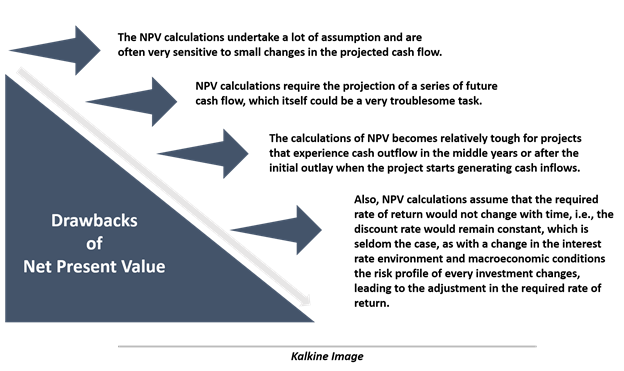
Some Drawbacks of Net Present Value

 Please wait processing your request...