What is time-series data?
A series of data recorded by observing a variable at fixed time intervals is called a time-series data. For example, recording daily weather data daily, weekly, or monthly. The time interval is called time series frequency.
Another type of recording time series data involves stochastic process. It can be defined as observing a set of random variables that are ordered in time.
Summary
- Observations of the values taken by a variable at fixed time intervals are called time-series data.
- Data from time series can be multivariate or univariate.
- For time series analysis of data to forecast, it is crucial to ensure its stationarity.
Frequently Asked Questions (FAQs)
What are some examples of time series data.
- Stock prices
- Prices of Assets
- Exchange rates
- GDP
- Retail sales
- Medical Vitals
- Weather forecast
- Inflation
- Interest rates
- Employment Data
- Demographic details
- Epidemiology
- Website traffic
Where all is time-series data used?
When plotting a time series data graphically, one axis would be incrementing time and the other the variable under study. In the case of time series data, the variable in question is expressed as a function of time.
- Time series analysis is required heavily in the field of data analytics. It is used for clustering, pattern detection, forecasting, detection of anomalies etc.
- In the field of communication engineering, it is used for signal detection.
- Science too used it for forecasting in addition to uses in the field of economics, econometrics and finance.
- Visualizing time series data helps in descriptive modelling- to observe trends or cycles or seasonal variations employing trend analysis and can instantly draw attention to any outliers or structural breaks while studying a data set. This helps to make informed decisions and projections about the future.
How can we classify time series?
Time series are can be classified through various types-
Stock and Flow
- Stock time series is when variables are recorded at a point of time at regular intervals like hourly measurement of body temperature.
- Flow stock series are when variables are measured over a period of time, as the case of annual GDP or quarterly sales.
Univariate time series and multivariate time series model
- When univariate time series the regressor or the dependent variable is a single time series like the health parameter of an individual, it is called univariate time series data.
- While if there are multiple regressors or multiple dependant variables, each dependant on each other based on their past and present value, then it is called multivariate time series data. For example study the movement of temperature, wind speed, and precipitation is a multivariate time series model.
Stationary time series data and Nonstationary time series data
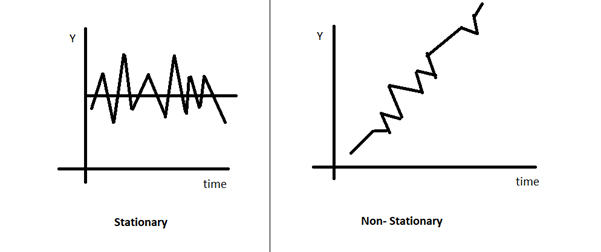
When the mean, variance, and autocovariance remain constant regardless of the lags, the time series is stationary. A stationary time series data tends to revert to the mean or hover very close to the expected value, and the deviations from the mean are almost similar in degree no matter at what time they are measured.
In contrast nonstationary time series data is when the mean and/or variance vary when there are lags. For the purpose of forecasting, non-stationary time series data may not be of much use because the moments of the probability distributions would be different at different points of time.

Copyright © 2021 Kalkine Media Pty Ltd
Nonstationary data may have a trend component, maybe cyclical or seasonal or random component.
Share prices are non-stationary time-series data that are said to follow the random walk model.
As per the efficient market hypothesis, share prices can't be speculated so as to make high profits by buying when prices fall and selling when prices rise. Models in random walk theory are characterised by random errors consistently over a period of time. So for a variable Y if the process started at time 0 then at time t
Yt = Y0 + ∑(u1 + u2 + u3 +….+ ut)
Since Y1 = Y0 + u1
Y2 = Y1 + u2 = Y0 + u1 + u2
Y3 = Y2 + u3= Y0 + u1 + u2 + u3
Yt = Y0 + ∑( u1 + u2 + u3 +…+ ut )
Yt is the value of Y in the current period t, Y0 is the value of Y when the process started, and ∑ut is called the stochastic trend, which is the total of the random shocks.
The above equations in terms of share prices implies that for a time series variable like exchange rate, today's exchange rate is a sum of yesterday's exchange rate and a random shock.
Thus, we see that for a random walk model, the varying variance violates stationarity condition required for forecasting.
This is also the reason why share prices cannot be forecasted because they too follow the random walk model. If the data is not stationary, generalizations cannot be made, and observations can be made only for the current period that is being observed.
As a result, we can conclude that stationarity must be checked when forecasting with time series data.
What is white noise process?
A random or white noise process is another type of time series or stochastic process. White noise process variables are independent and identically distributed with mean being zero and variance being constant, and there is zero correlation between any two variables of the data. In layman terms, the white noise process data is random, and the scope of forecasting using such data is nil.
 Please wait processing your request...