
Section 1: Company Overview and Fundamentals
1.1 Company Overview:
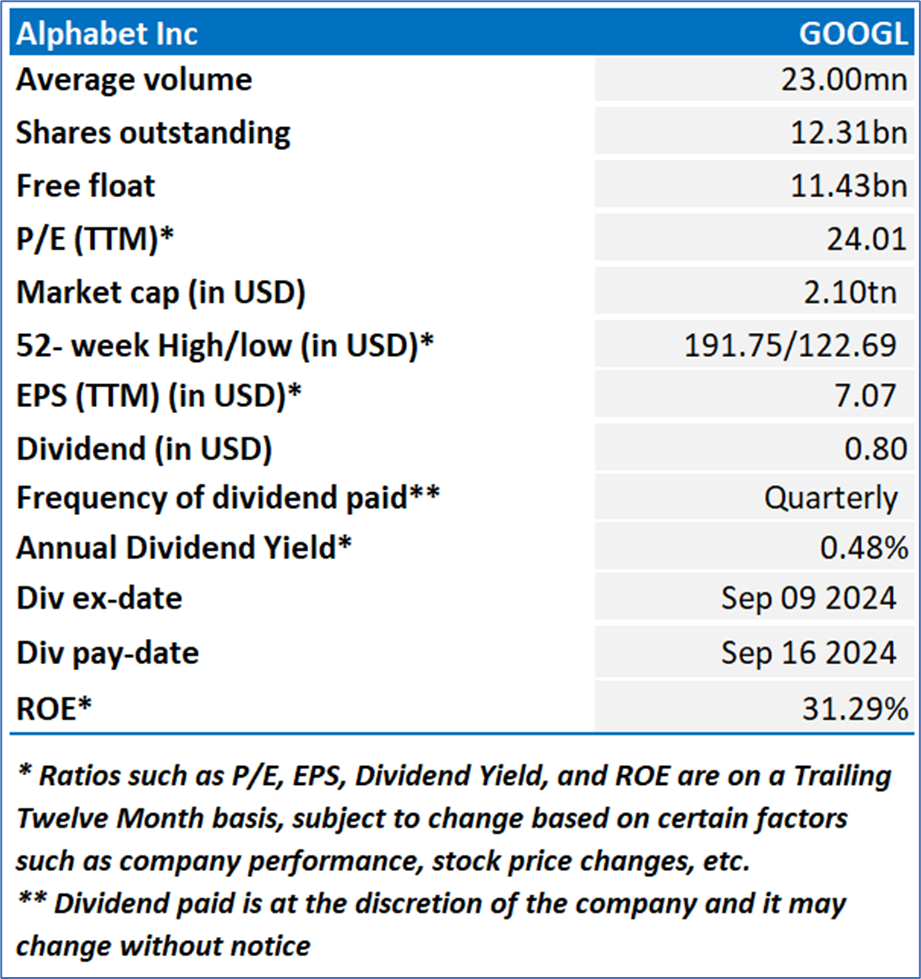
Alphabet Inc. (NASDAQ: GOOGL) is a holding company. The Company's segments include Google Services, Google Cloud, and Other Bets. The Google Services segment includes products and services such as ads, Android, Chrome, devices, Google Maps, Google Play, Search, and YouTube. Google Cloud segment includes infrastructure and platform services, collaboration tools, and other services for enterprise customers. Its Other Bets segment is engaged in the sale of healthcare-related services and Internet services.
Kalkine’s Diversified Opportunities Report covers the Company Overview, Key positives & negatives, Investment summary, Key investment metrics, Top 10 shareholding, Business updates and insights into company recent financial results, Key Risks & Outlook, Price performance and technical summary, Target Price, and Recommendation on the stock.
Stock Performance:
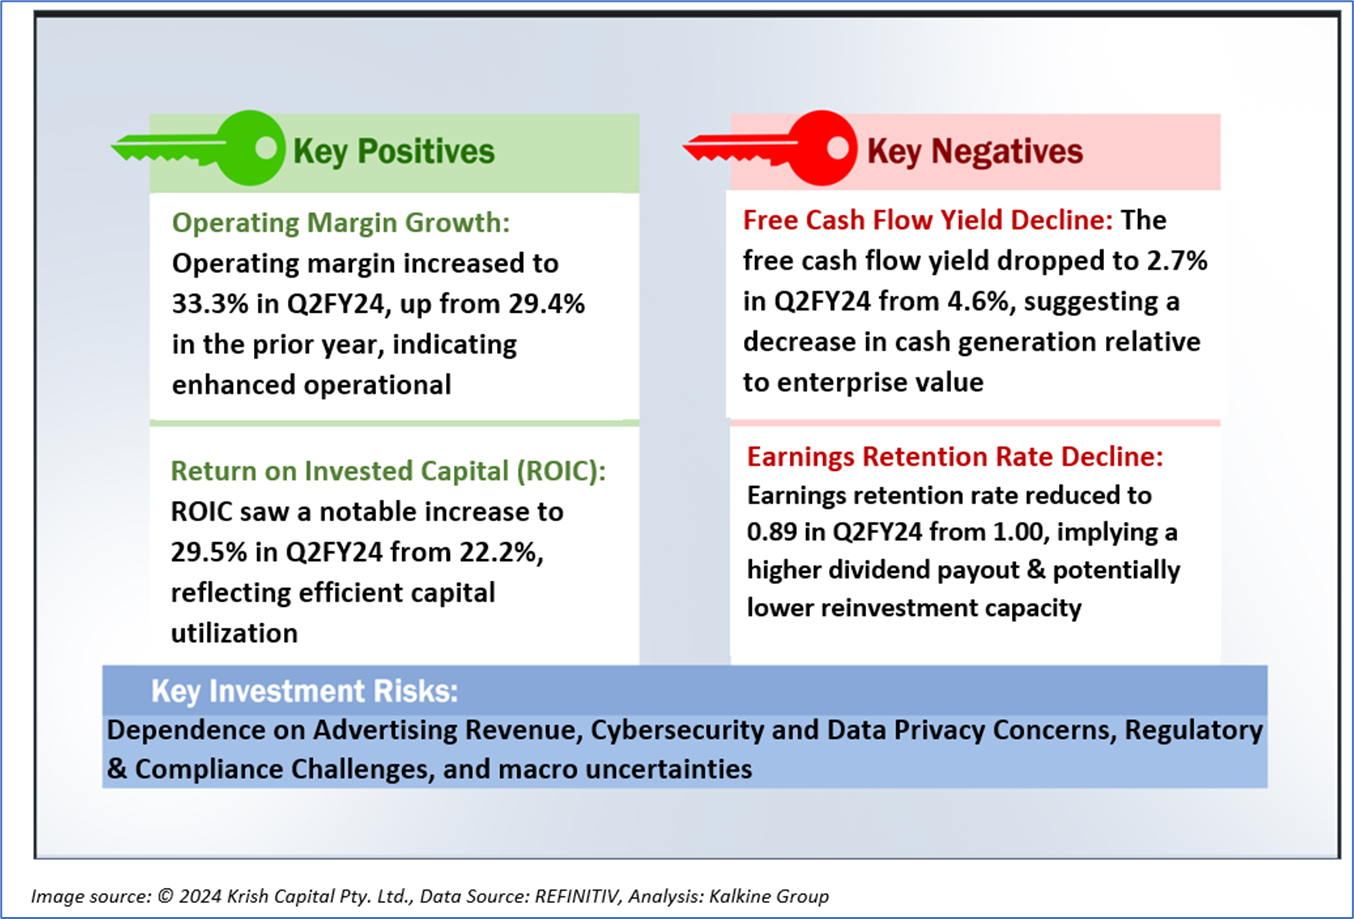
1.2 The Key Positives, Negatives, and Investment summary
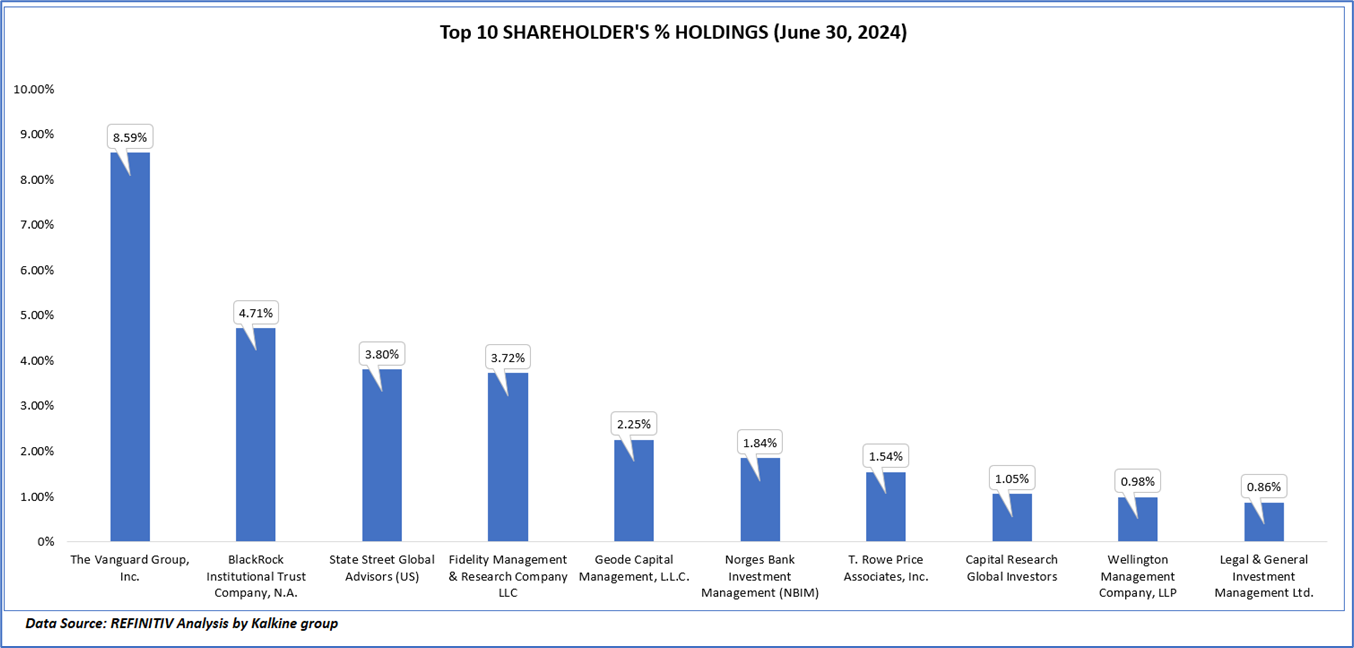
1.3 Top 10 shareholders:
The top 10 shareholders together form ~29.32% of the total shareholding, signifying diverse shareholding. The Vanguard Group, Inc., and BlackRock Institutional Trust Company, N.A. are the biggest shareholders, holding the maximum stake in the company at 8.59% and 4.71%, respectively.
1.4 Key Metrics
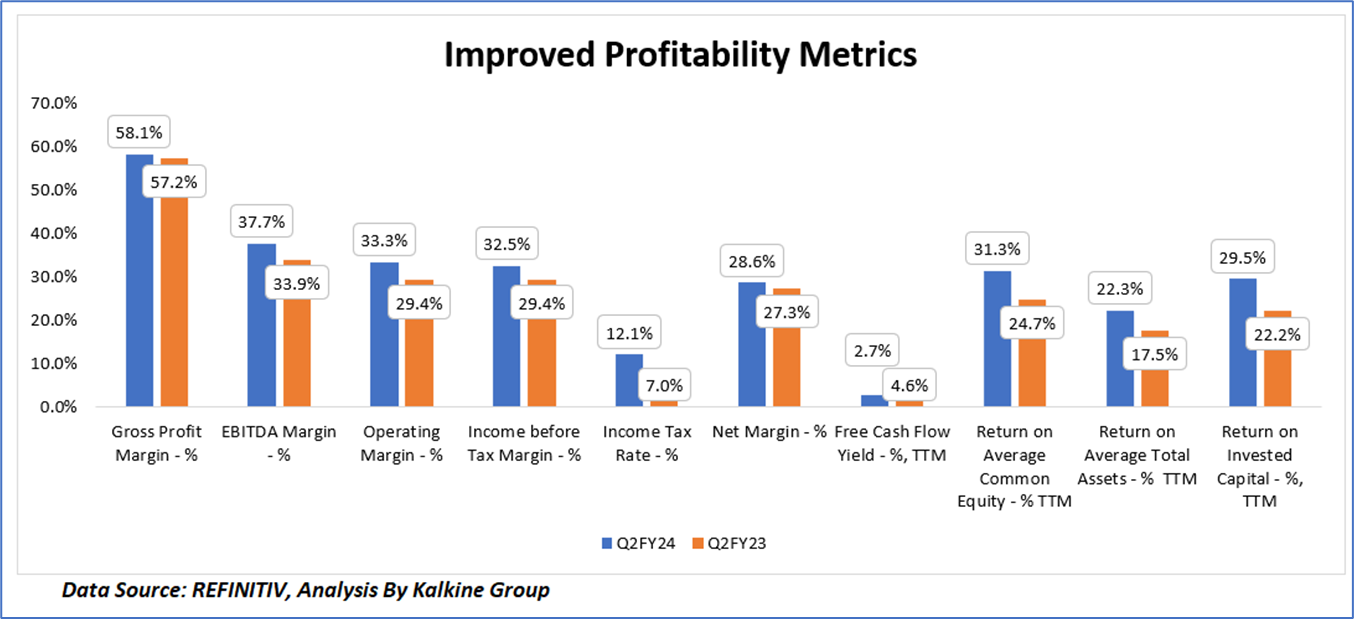
In Q2FY24, Alphabet Inc. achieved notable growth in profitability and return metrics, reflecting a strong operational performance and effective capital deployment. The rise in gross profit margin from 57.2% to 58.1% and EBITDA margin from 33.9% to 37.7% indicates that Alphabet has effectively managed its costs, possibly through operational efficiencies or revenue growth in high-margin segments like Google Services and Cloud. The increase in operating margin to 33.3% from 29.4% further suggests that Alphabet’s core business segments are generating more income relative to expenses.
The income before tax margin rose to 32.5%, up from 29.4%, showcasing a robust pre-tax profitability. Despite a higher income tax rate (12.1% compared to 7.0% in Q2FY23), Alphabet managed to improve its net margin from 27.3% to 28.6%, signaling that its earnings growth outpaced the impact of higher taxes.
While free cash flow yield decreased from 4.6% to 2.7%, likely due to increased capital expenditures or working capital needs, the return on average common equity (31.3% vs. 24.7%), return on average total assets (22.3% vs. 17.5%), and return on invested capital (29.5% vs. 22.2%) all showed substantial gains. These improvements suggest that Alphabet has not only grown its earnings but also utilized its assets and shareholder equity more effectively, enhancing value for investors. Overall, Alphabet's Q2FY24 performance reflects a strategically managed expansion, with increased profitability and returns despite some pressures on free cash flow.
Section 2: Business Updates and Corporate Business Highlights
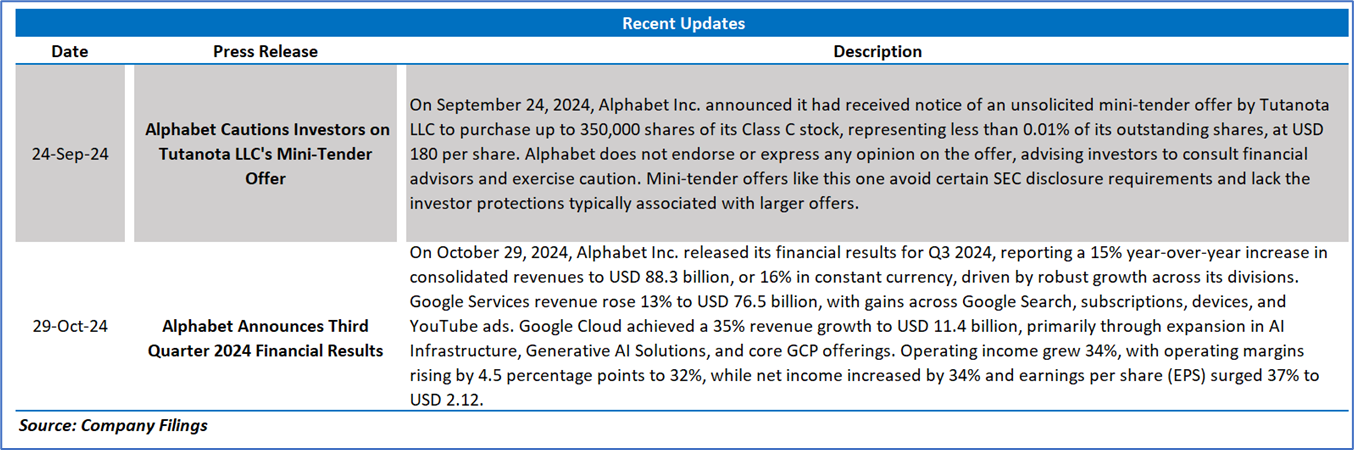
2.1 Recent Updates:
The below picture gives an overview of the recent updates:
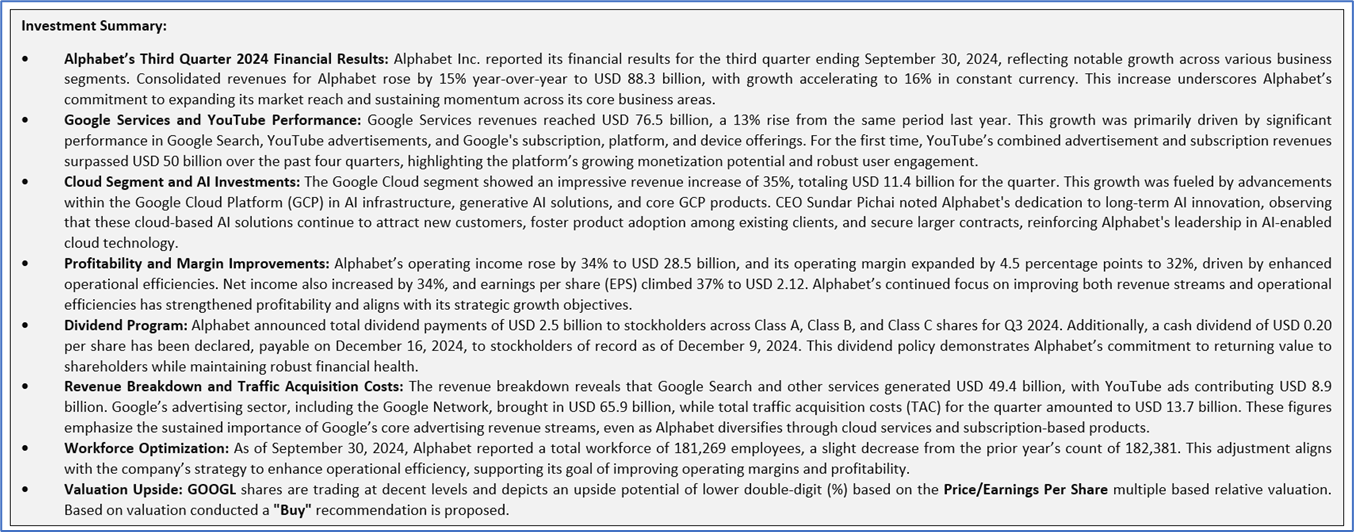
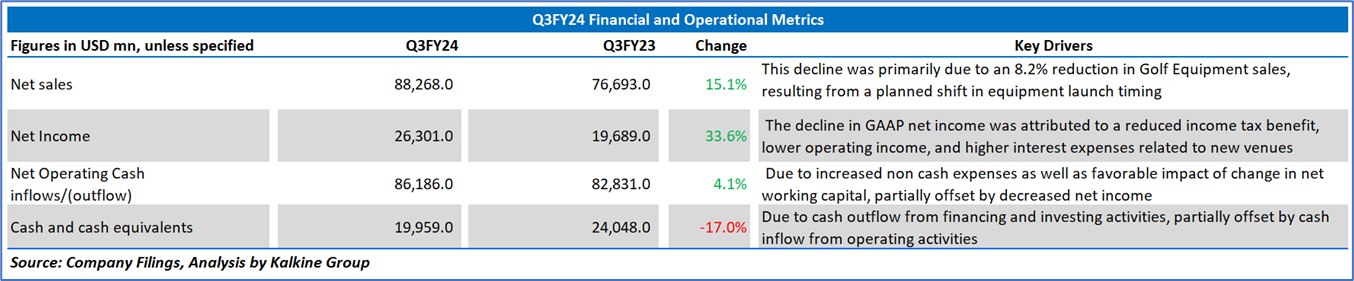
2.2 Insights of Q3FY24:
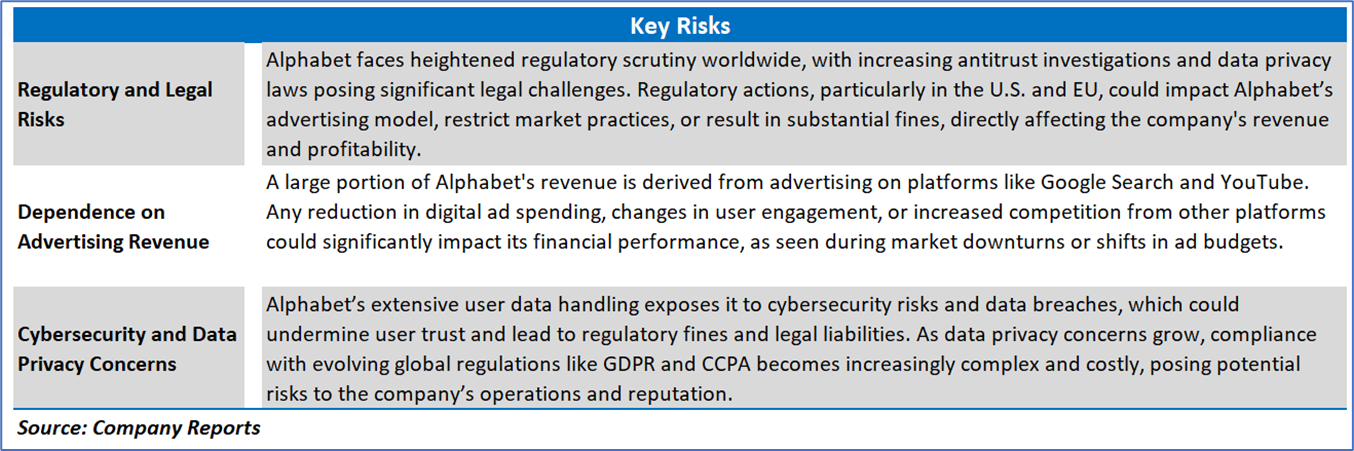
Section 3: Key Risks & Outlook
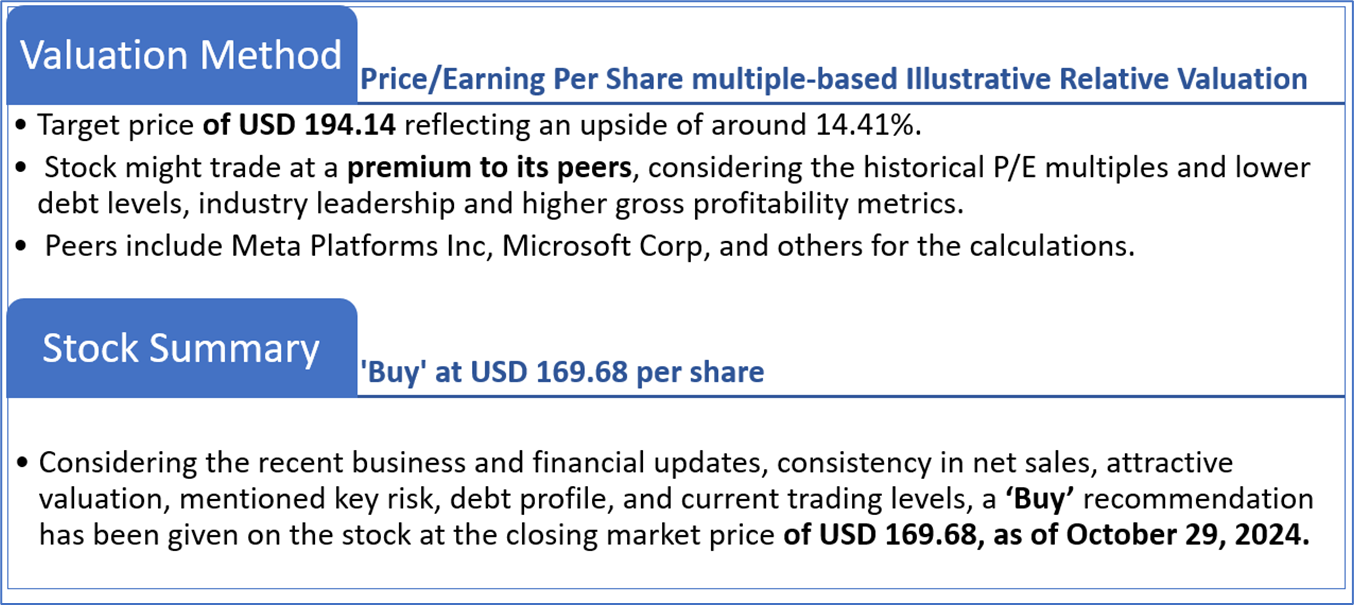
Section 4: Stock Recommendation Summary:
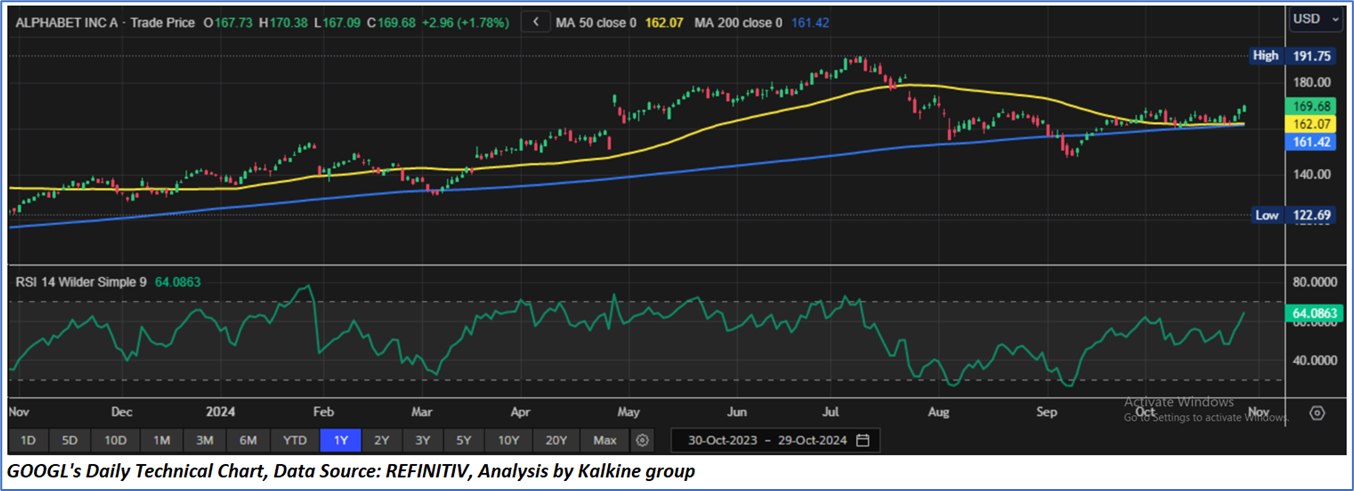
4.1 Price Performance and Technical Summary:
Stock Performance:
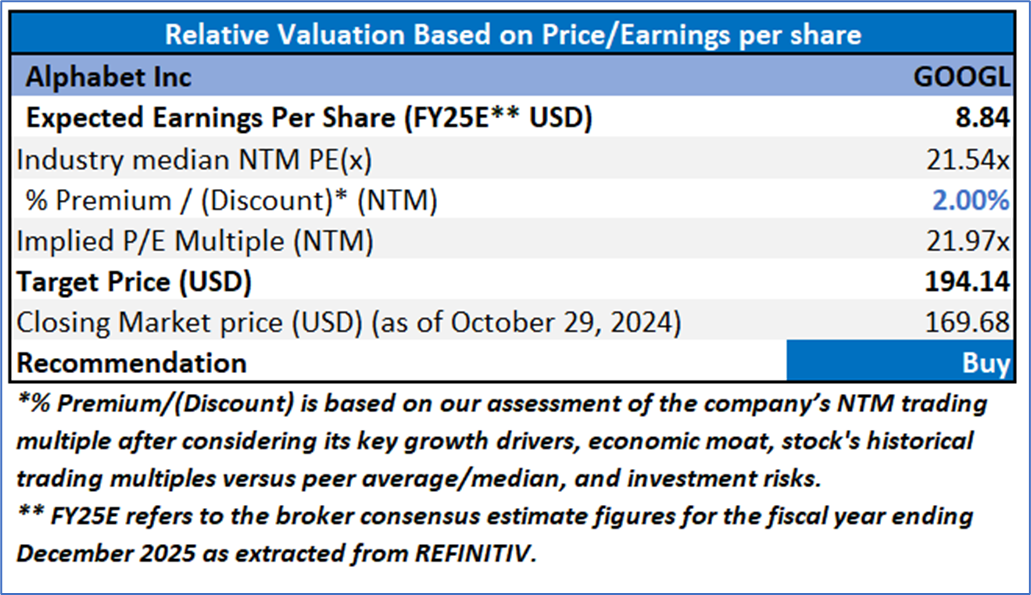
4.2 Fundamental Valuation
Valuation Methodology: Price/Earnings Per Share Multiple Based Relative Valuation
Markets are trading in a highly volatile zone currently due to certain macroeconomic issues and geopolitical tensions prevailing. Therefore, it is prudent to follow a cautious approach while investing.
Note 1: Past performance is not a reliable indicator of future performance.
Note 2: The reference date for all price data, currency, technical indicators, support, and resistance levels is October 29, 2024. The reference data in this report has been partly sourced from REFINITIV.
Note 3: Investment decisions should be made depending on an individual's appetite for upside potential, risks, holding duration, and any previous holdings. An 'Exit' from the stock can be considered if the Target Price mentioned as per the Valuation and or the technical levels provided has been achieved and is subject to the factors discussed above.
Note 4: The report publishing date is as per the Pacific Time Zone.
Technical Indicators Defined: -
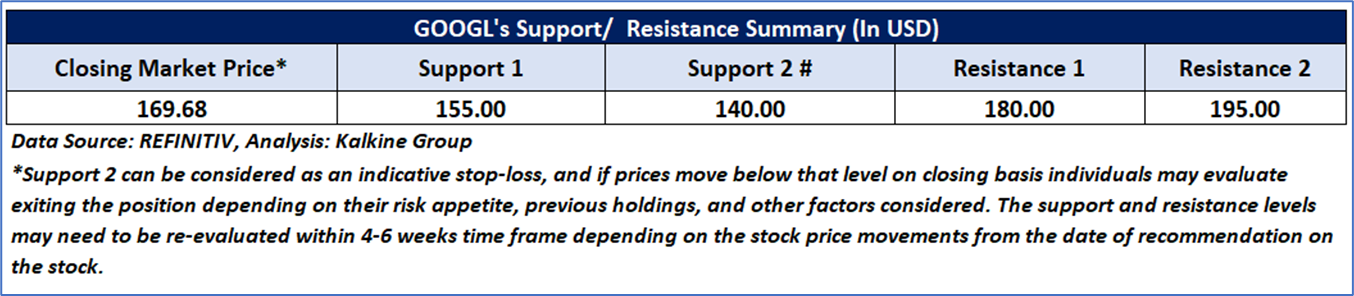
Support: A level at which the stock prices tend to find support if they are falling, and a downtrend may take a pause backed by demand or buying interest. Support 1 refers to the nearby support level for the stock and if the price breaches the level, then Support 2 may act as the crucial support level for the stock.
Resistance: A level at which the stock prices tend to find resistance when they are rising, and an uptrend may take a pause due to profit booking or selling interest. Resistance 1 refers to the nearby resistance level for the stock and if the price surpasses the level, then Resistance 2 may act as the crucial resistance level for the stock.
Stop-loss: It is a level to protect against further losses in case of unfavorable movement in the stock prices.
The advice given by Kalkine Canada Advisory Services Inc. and provided on this website is general information only and it does not take into account your investment objectives, financial situation and the particular needs of any particular person. You should therefore consider whether the advice is appropriate to your investment objectives, financial situation and needs before acting upon it. You should seek advice from a financial adviser, stockbroker or other professional (including taxation and legal advice) as necessary before acting on any advice. Not all investments are appropriate for all people. The website www.kalkine.ca is published by Kalkine Canada Advisory Services Inc. The link to our Terms & Conditions has been provided please go through them. On the date of publishing this report (mentioned on the website), employees and/or associates of Kalkine do not hold positions in any of the stocks covered on the website. These stocks can change any time and readers of the reports should not consider these stocks as advice or recommendations later.
 Please wait processing your request...