
Section 1: Company Overview and Fundamentals
1.1 Company Overview:
Bank of America Corporation (NYSE: BAC) is a bank holding company and a financial holding company. Its segments include Consumer Banking, Global Wealth & Investment Management (GWIM), Global Banking and Global Markets.
Kalkine’s Dividend Income Report covers the Company Overview, Key positives & negatives, Investment summary, Key investment metrics, Top 10 shareholding, Business updates and insights into company recent financial results, Key Risks & Outlook, Price performance and technical summary, Target Price, and Recommendation on the stock.
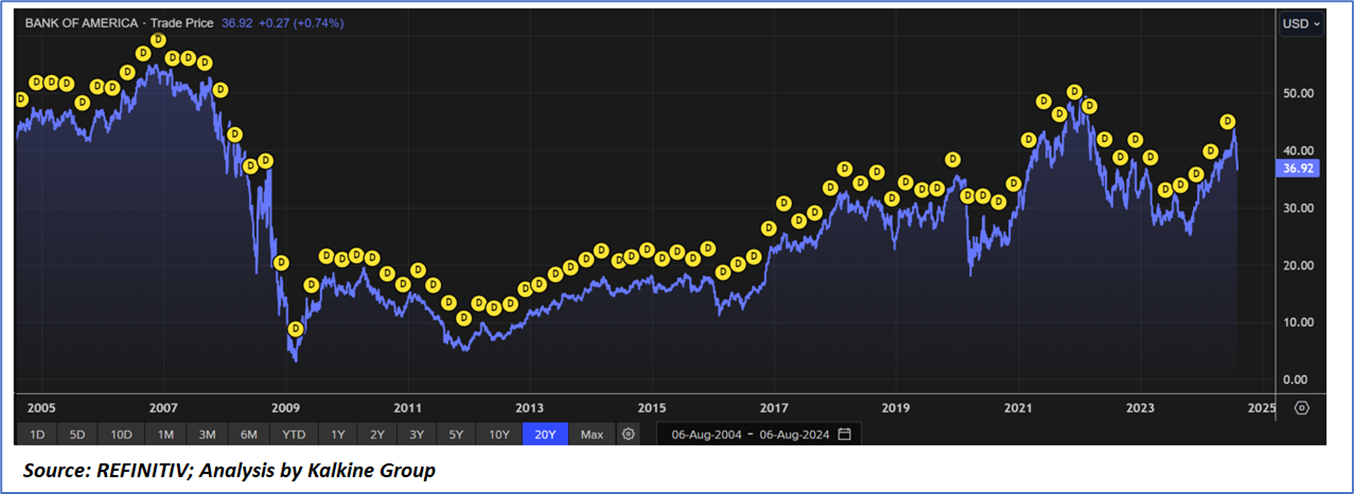
Price Performance:
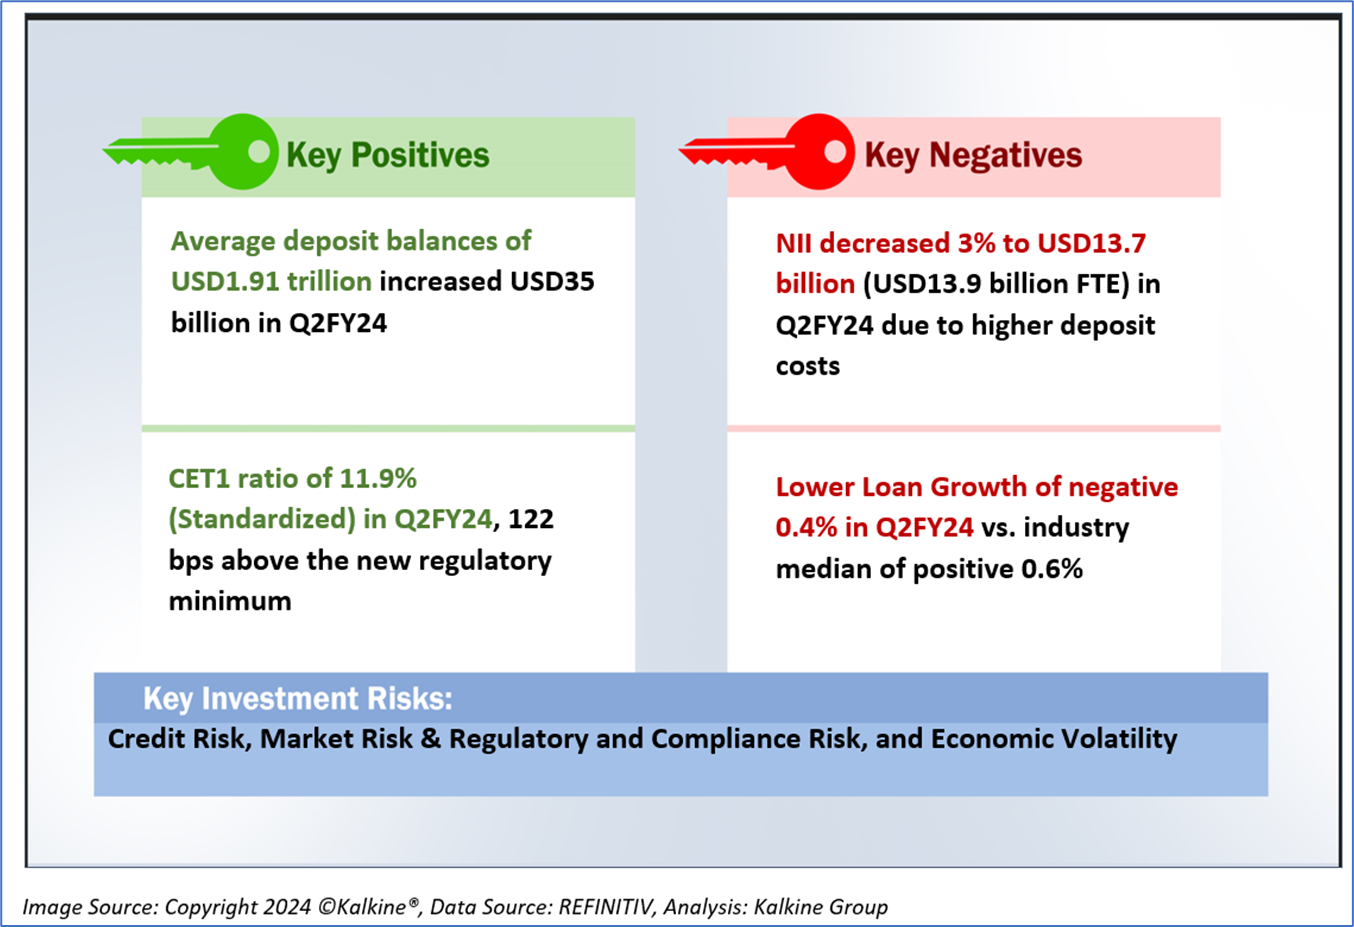
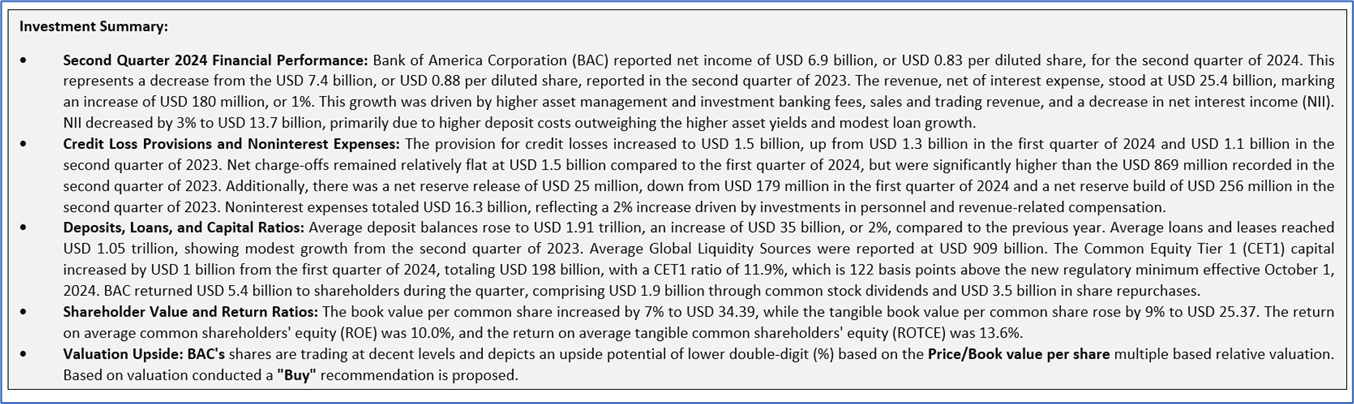
1.2 The Key Positives, Negatives, and Investment summary
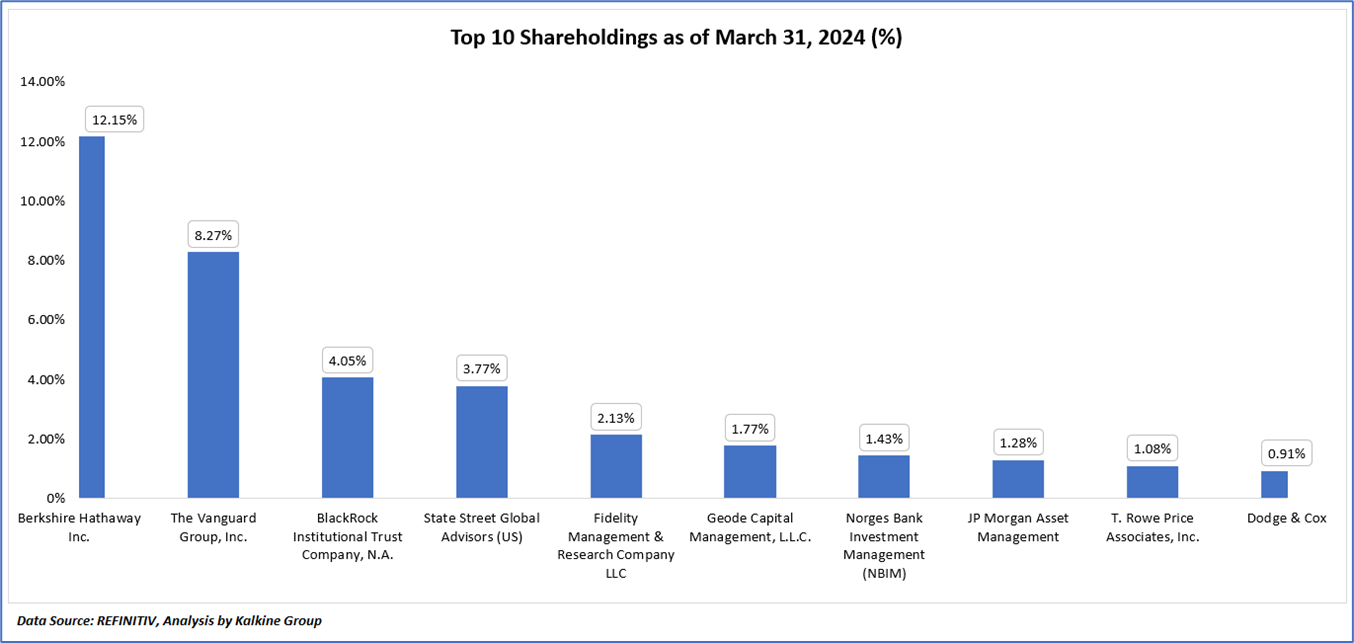
1.3 Top 10 shareholders:
The top 10 shareholders together form ~36.83% of the total shareholding, signifying concentrated shareholding. Berkshire Hathaway Inc. and The Vanguard Group, Inc., are the biggest shareholders, holding the maximum stake in the company at ~12.15% and ~8.27%, respectively.
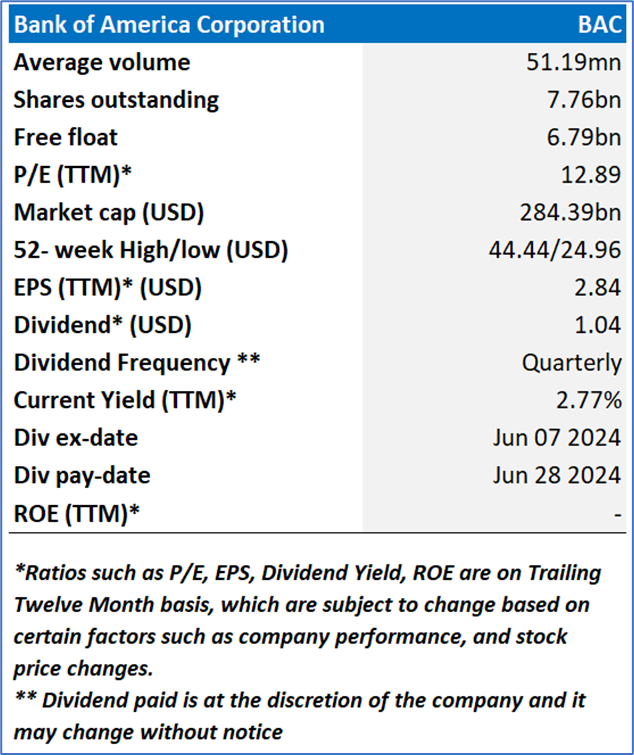
1.4 Dividend payments with impressive dividend yield:
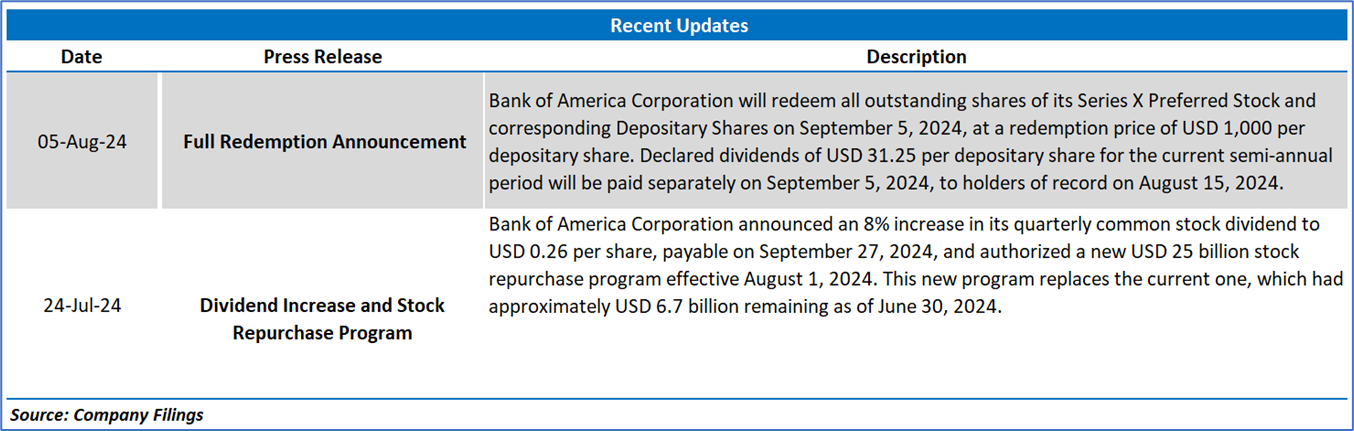
Bank of America Corporation has returned USD 5.4 billion to shareholders, comprising USD 1.9 billion through common stock dividends and USD 3.5 billion in share repurchases. The Board of Directors has declared a regular quarterly cash dividend of USD 0.26 per share on Bank of America common stock, an increase of USD 0.02 from the prior quarter. This dividend will be payable on September 27, 2024, to shareholders of record as of September 6, 2024. Additionally, the Board has declared a regular quarterly cash dividend of USD 1.75 per share on the 7% Cumulative Redeemable Preferred Stock, Series B, payable on October 25, 2024, to shareholders of record as of October 11, 2024.
This dividend increase continues Bank of America's history of delivering value to its shareholders through consistent and growing dividend payouts. Over the past decade, the company has steadily increased its dividend, reflecting its strong financial performance and commitment to returning capital to shareholders. The recent increase in the common stock dividend underscores the Board's confidence in the bank's ability to generate sustainable earnings and its dedication to enhancing shareholder value.
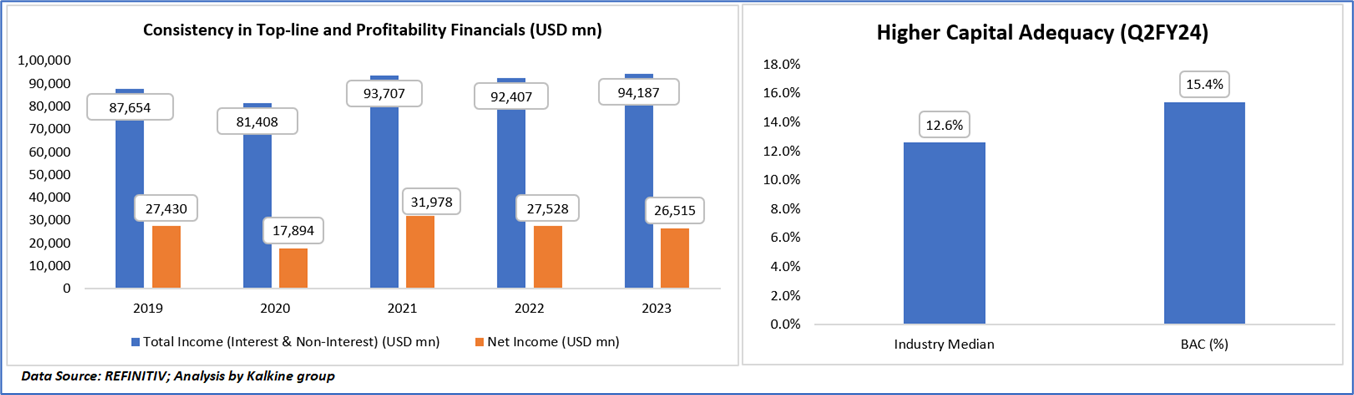
1.5 Key Metrics
BAC's financial performance reflects strong stability and growth, with total income rising from USD 87.7 billion in 2019 to USD 94.2 billion in 2023, despite fluctuations in net income. The bank's Tier 1 Risk-Adjusted Capital Ratio of 15.4% significantly surpasses the industry median of 12.6%, highlighting its robust capital position and effective risk management. Additionally, BAC's Common Equity Tier 1 (CET1) capital has increased by USD 1 billion from Q1 FY24, reaching USD 198 billion, with a CET1 ratio of 11.9%—122 basis points above the new regulatory minimum effective October 1, 2024—demonstrating the bank's strong financial health and proactive regulatory compliance.
Section 2: Business Updates and Financial Highlights
2.1 Recent Updates:
The below picture gives an overview of the recent updates:
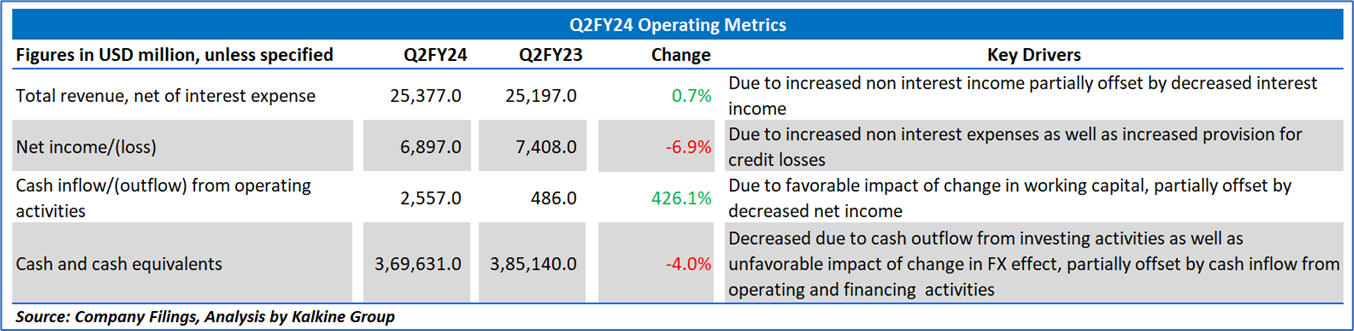
2.2 Insights of Q2FY24:
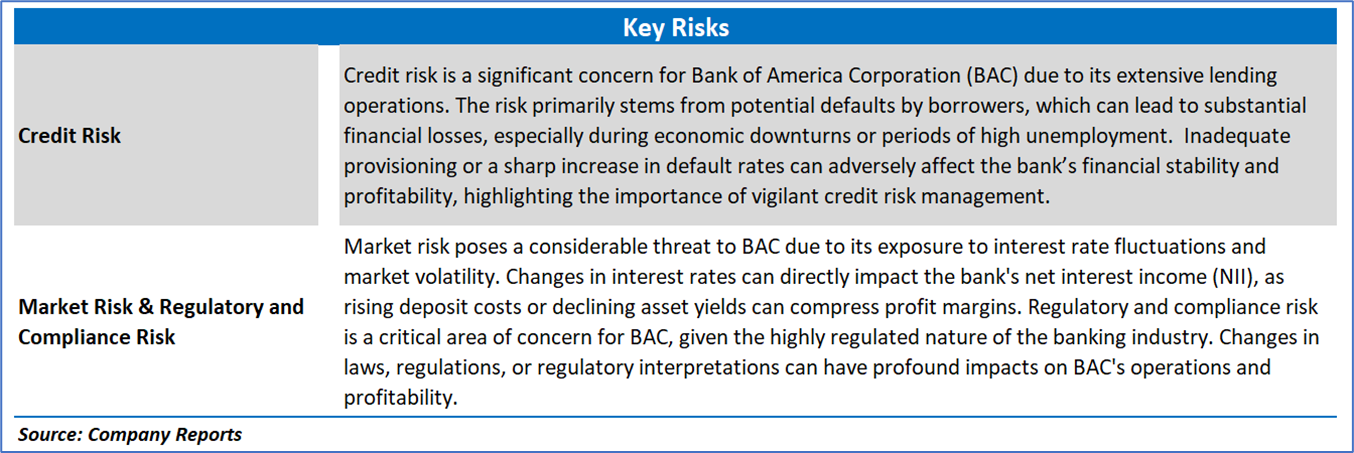
Section 3: Key Risks and Outlook:
Section 4: Stock Recommendation Summary:
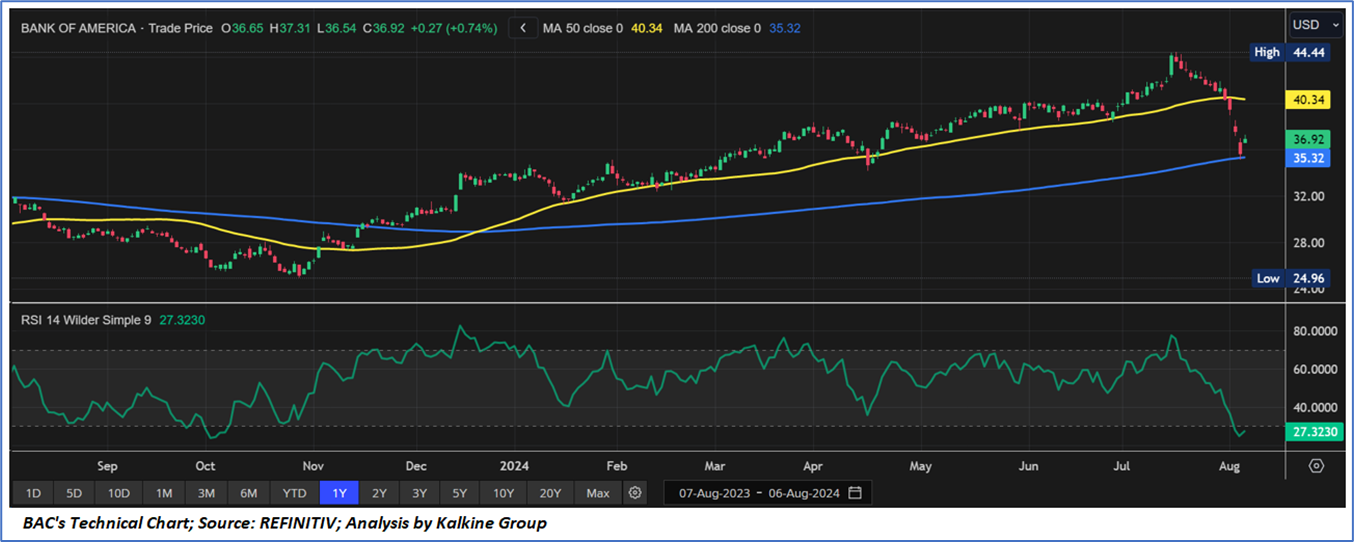
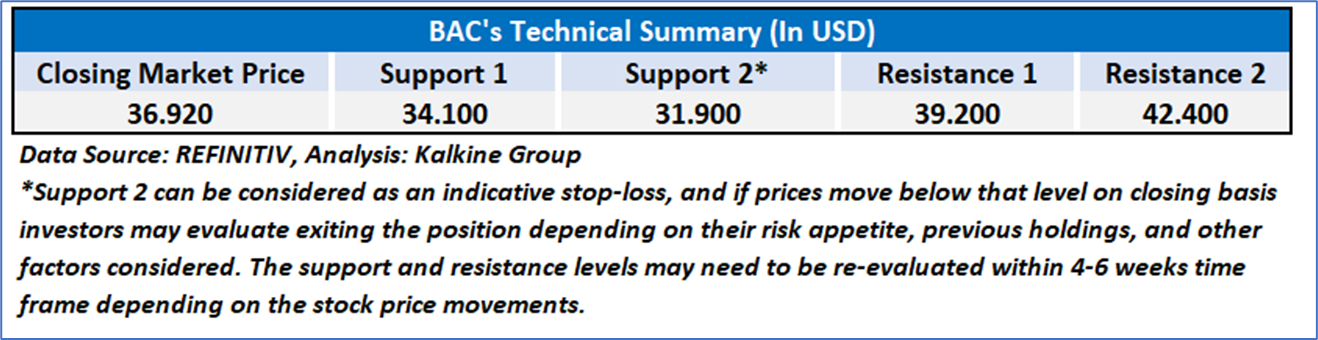
4.1 Technical Summary:
Price Performance:
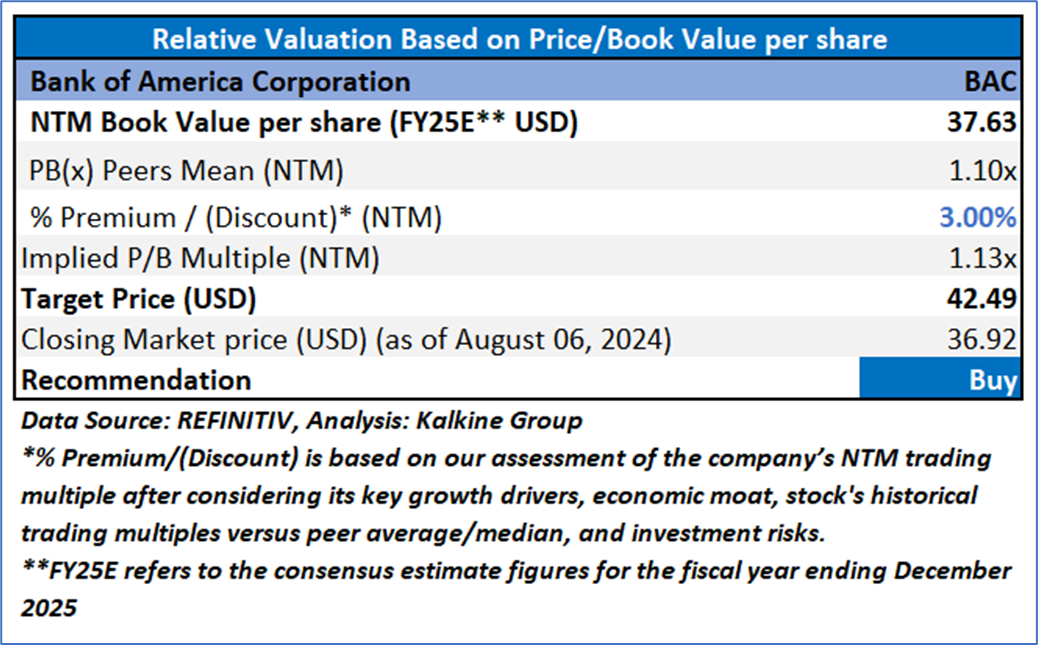
4.2 Fundamental Valuation
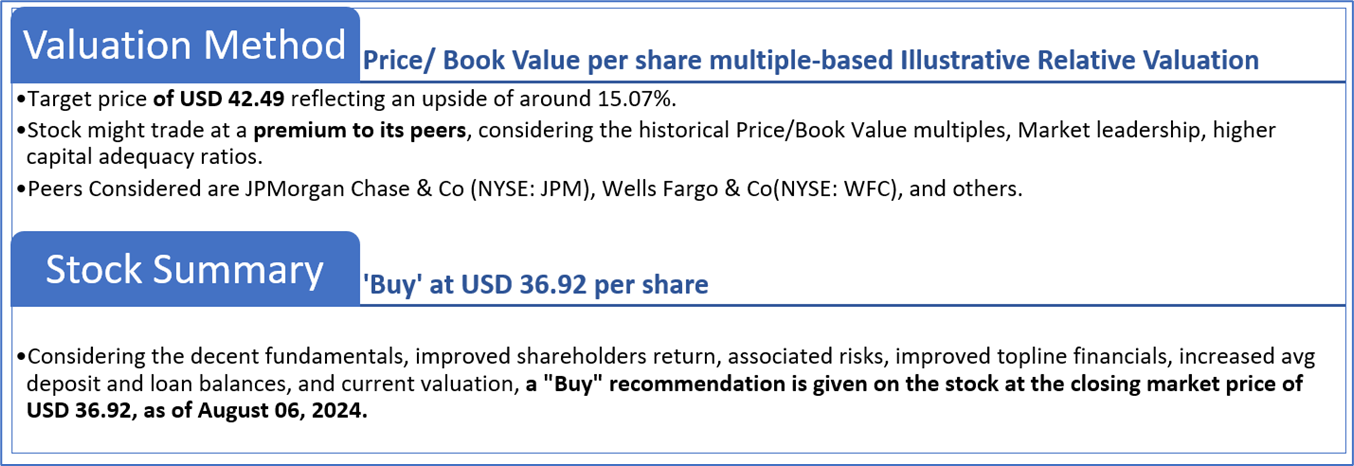
Valuation Methodology: Price/Book Value Per Share Multiple Based Relative Valuation
Markets are trading in a highly volatile zone currently due to certain macroeconomic issues and geopolitical tensions prevailing. Therefore, it is prudent to follow a cautious approach while investing.
Note 1: Past performance is not a reliable indicator of future performance.
Note 2: The reference date for all price data, currency, technical indicators, support, and resistance levels is August 06, 2024. The reference data in this report has been partly sourced from REFINITIV.
Note 3: Investment decisions should be made depending on an individual's appetite for upside potential, risks, holding duration, and any previous holdings. An 'Exit' from the stock can be considered if the Target Price mentioned as per the Valuation and or the technical levels provided has been achieved and is subject to the factors discussed above.
Note 4: The report publishing date is as per the Pacific Time Zone.
Technical Indicators Defined: -
Support: A level at which the stock prices tend to find support if they are falling, and a downtrend may take a pause backed by demand or buying interest. Support 1 refers to the nearby support level for the stock and if the price breaches the level, then Support 2 may act as the crucial support level for the stock.
Resistance: A level at which the stock prices tend to find resistance when they are rising, and an uptrend may take a pause due to profit booking or selling interest. Resistance 1 refers to the nearby resistance level for the stock and if the price surpasses the level, then Resistance 2 may act as the crucial resistance level for the stock.
Stop-loss: It is a level to protect against further losses in case of unfavorable movement in the stock prices.
The advice given by Kalkine Canada Advisory Services Inc. and provided on this website is general information only and it does not take into account your investment objectives, financial situation and the particular needs of any particular person. You should therefore consider whether the advice is appropriate to your investment objectives, financial situation and needs before acting upon it. You should seek advice from a financial adviser, stockbroker or other professional (including taxation and legal advice) as necessary before acting on any advice. Not all investments are appropriate for all people. The website www.kalkine.ca is published by Kalkine Canada Advisory Services Inc. The link to our Terms & Conditions has been provided please go through them. On the date of publishing this report (mentioned on the website), employees and/or associates of Kalkine do not hold positions in any of the stocks covered on the website. These stocks can change any time and readers of the reports should not consider these stocks as advice or recommendations later.
 Please wait processing your request...