
Section 1: Commodity Update:
The copper industry plays a vital role across construction, electronics, and renewable energy due to its superior electrical and thermal conductivity. Leading producers like Chile and Peru are key to global supply, while innovations in technology and recycling are transforming production and reducing environmental impact. Canada boasts nearly 900 million tonnes of copper reserves in sulphide and porphyry deposits and produced 510,782 tonnes of copper concentrate in 2022, a slight increase from a decade low of 509,350 tonnes in 2021. Canadian copper refineries are located in Newfoundland and Labrador, Quebec, Ontario, and Alberta. Copper prices fluctuate due to supply-demand factors and economic conditions, with future growth driven by electric vehicles and renewable energy technologies. The industry faces challenges related to regulatory compliance and resource depletion.
Data Source: Government of Canada
Section 2: Company Overview and Fundamental Insights:
2.1 Company Overview:
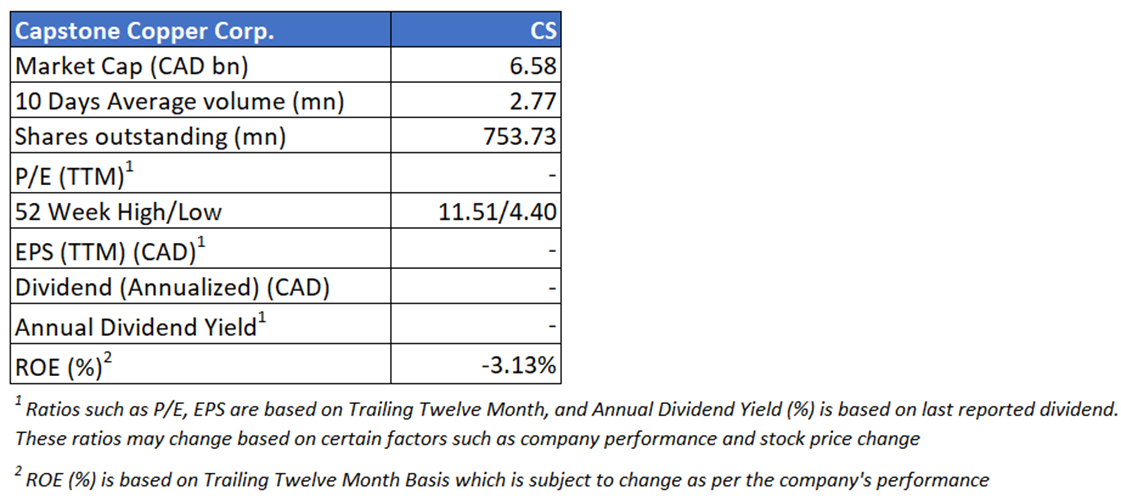
Capstone Copper Corp. (TSX: CS) is a company that mines, explores, and develops mineral properties in the Americas. Specifically, the group has operating mines in the US, Mexico, and Canada, and development projects in Chile and Canada. Capstone's main focus is copper, but the company also produces zinc, lead, molybdenum, silver, and gold.
Kalkine’s Resource Report covers the Investment Highlights, Key Financial Metrics, Risks, Technical Analysis along with the Valuation, Target Price, and Recommendation on the stock.
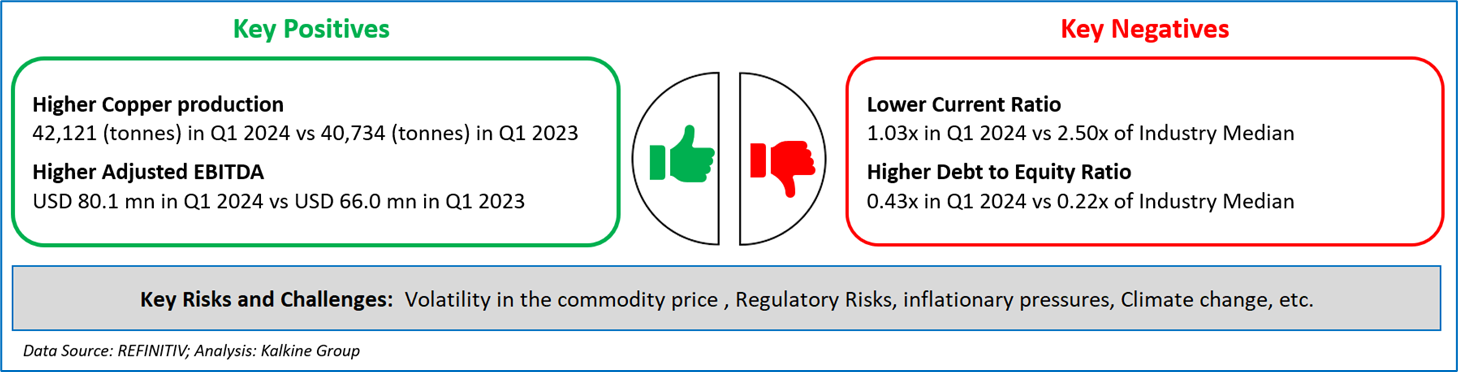
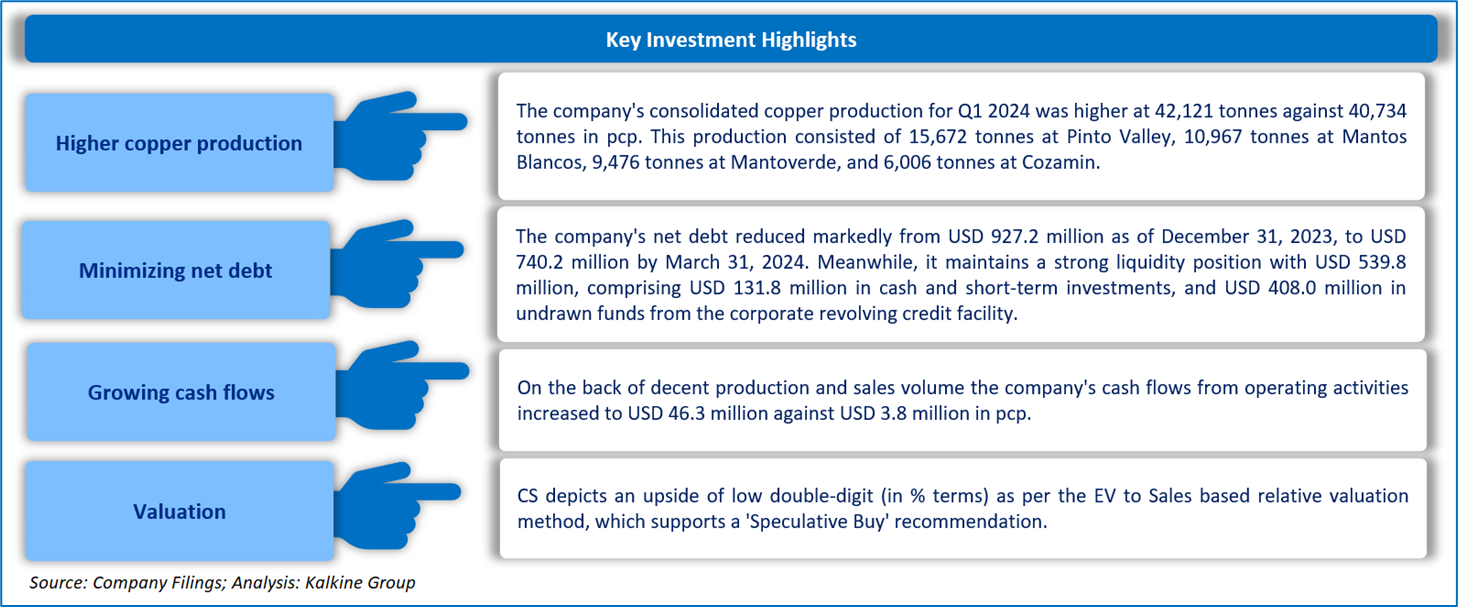
2.2 The Key Positives, Negatives, Investment Highlights and Risks
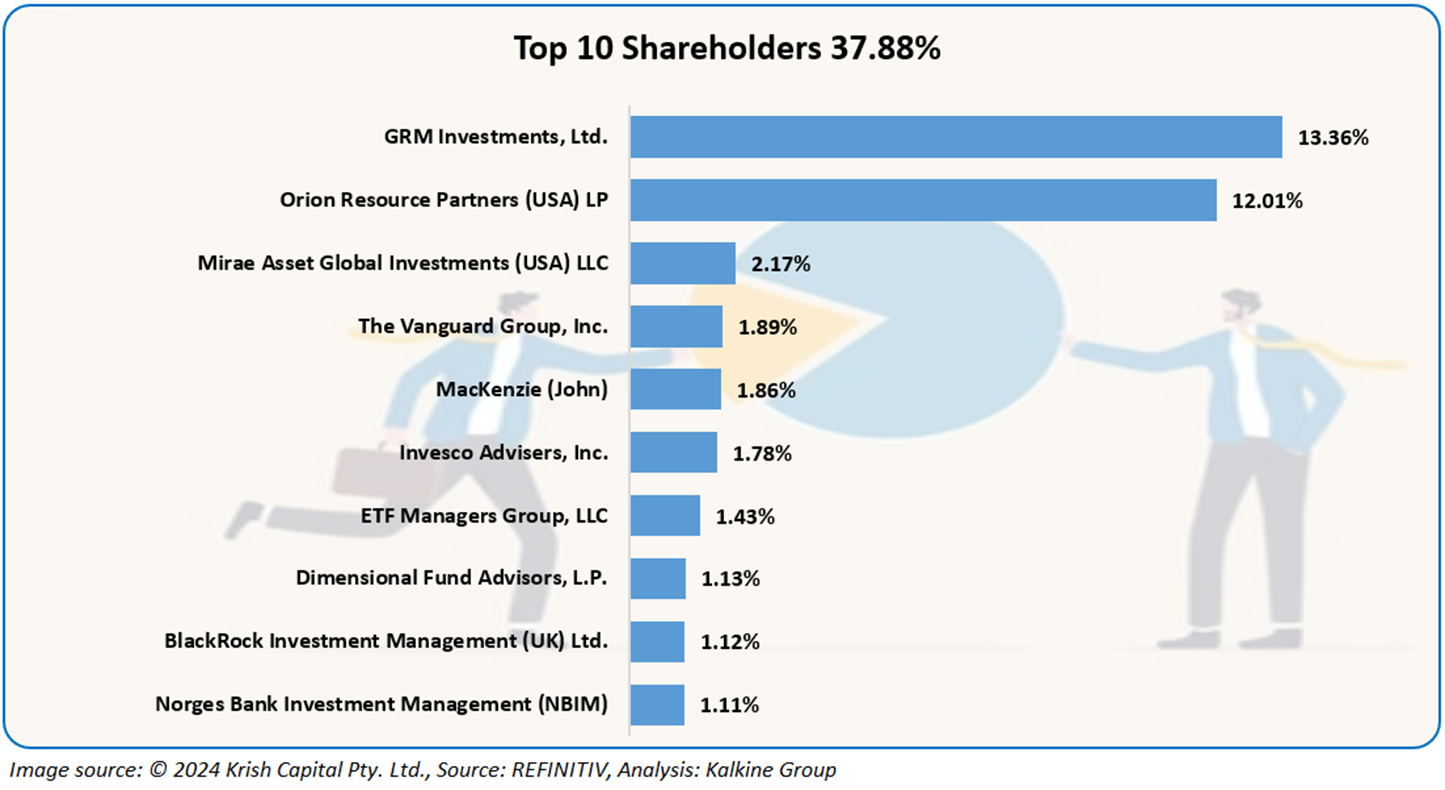
2.3 Top 10 Shareholders:
The top 10 shareholders together form ~37.88% of the total shareholding. GRM Investments, Ltd. and Orion Resource Partners (USA) LP hold a maximum stake in the company at ~13.36% and ~12.01%, respectively.
2.4 Key Metrics:
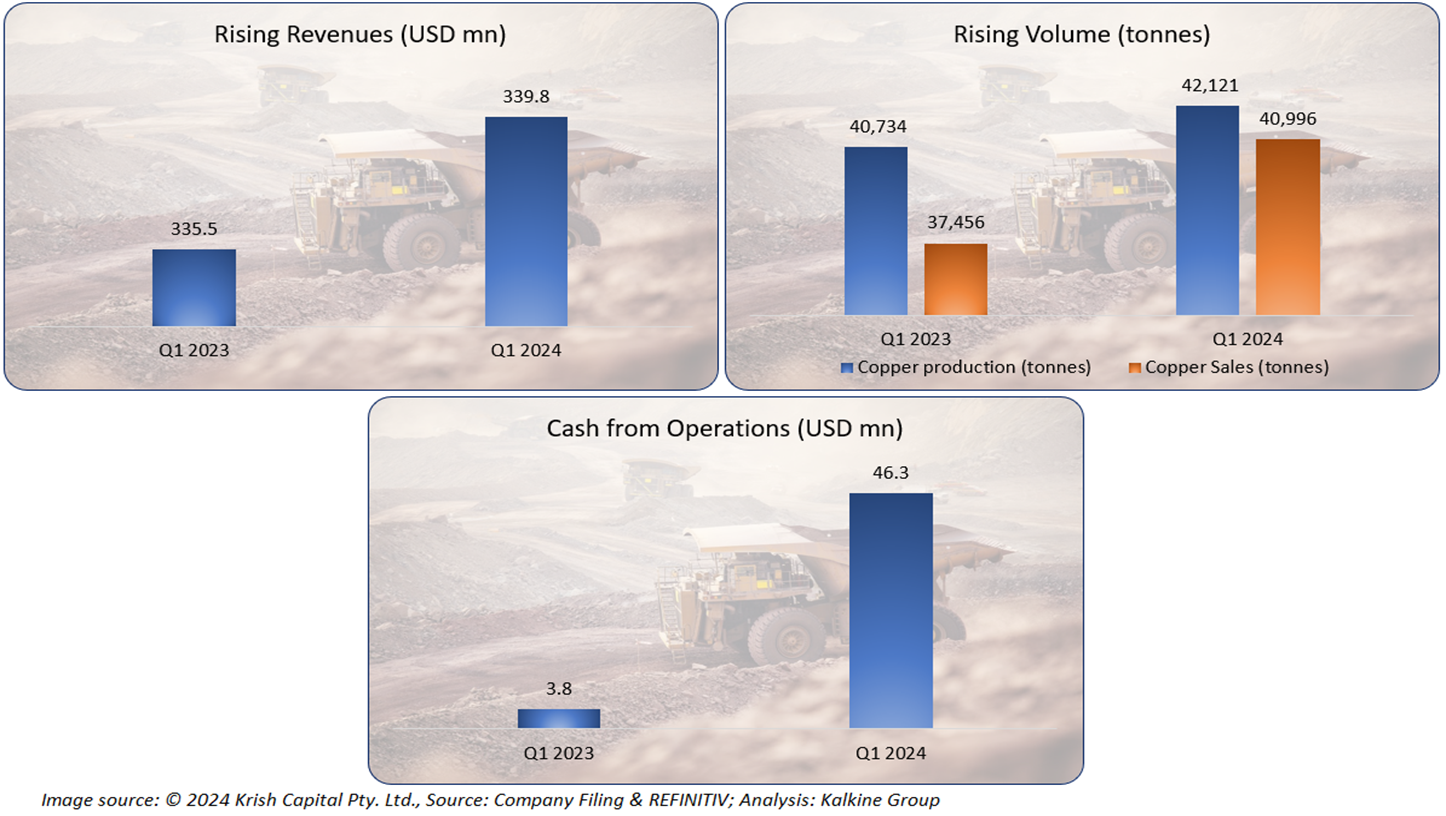
The company has reported an increase in its revenue in Q1 2024, which is a key positive. The rise in revenue was mainly due to higher production and sales volume in Q1 2024 compared to pcp. Furthermore, the company's cash from operations also stood up, which is a significant plus.
Section 3: Business Updates and Financial Highlights
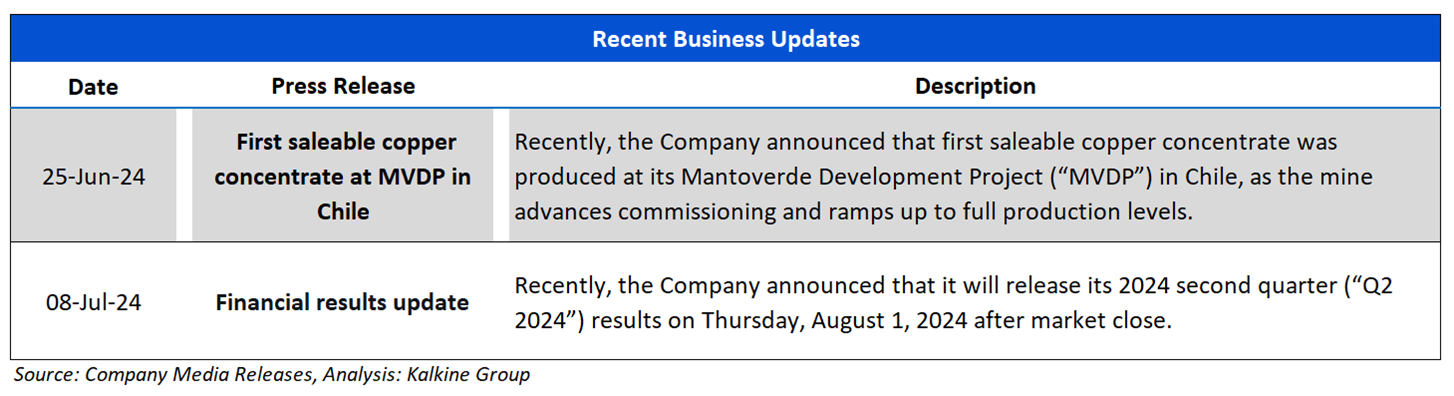
3.1 Recent Updates: The below picture gives an overview of the company’s recent activity where it shared an update on its first saleable copper concentrate production at MVDP and an update on its upcoming financial results.
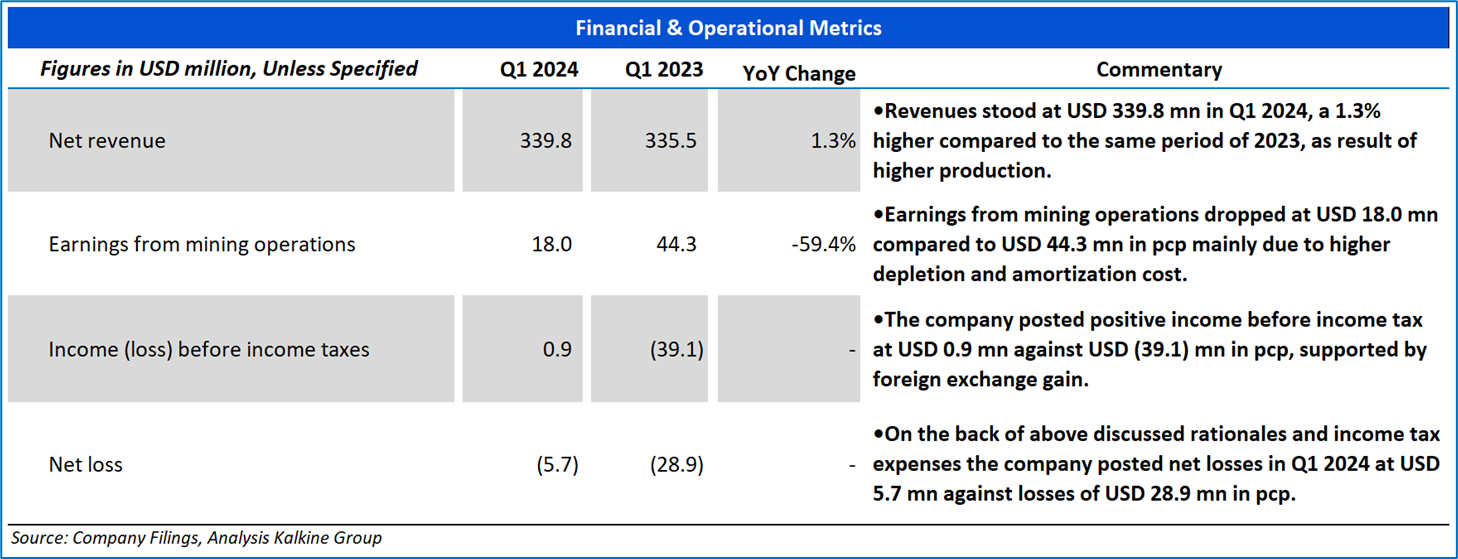
3.2 Insights of Q1 2024 Financial Performance:
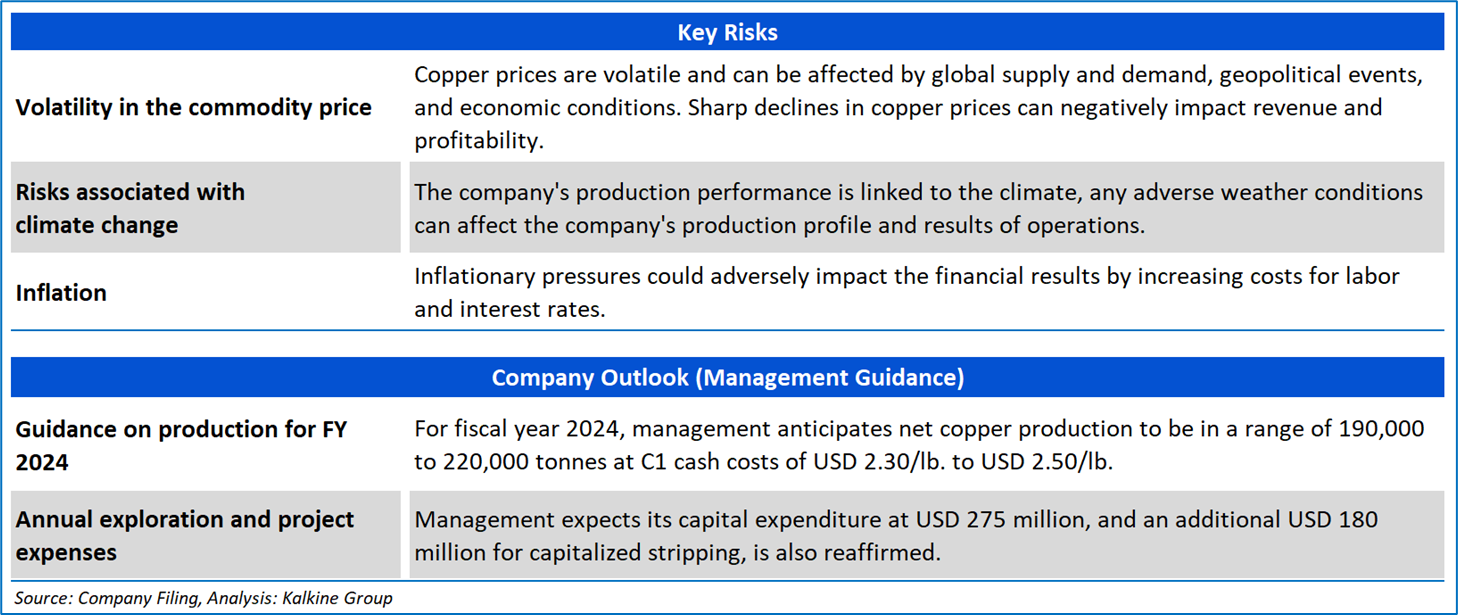
Section 4: Key Risks and Company Outlook
Section 5: Stock Recommendation Summary:
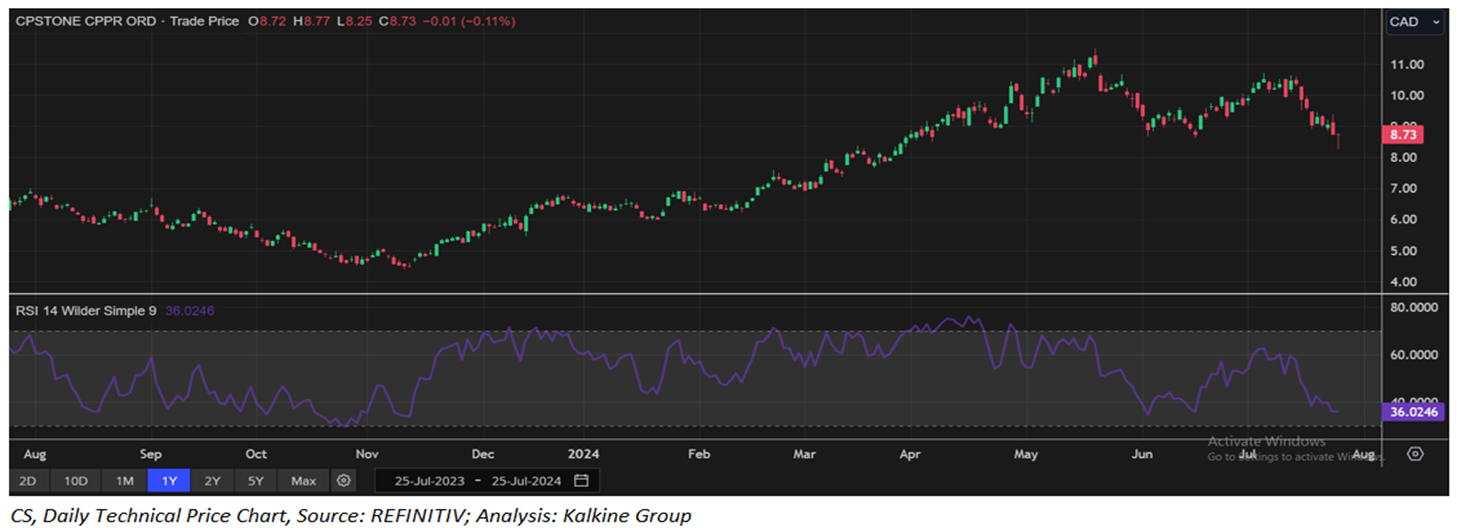
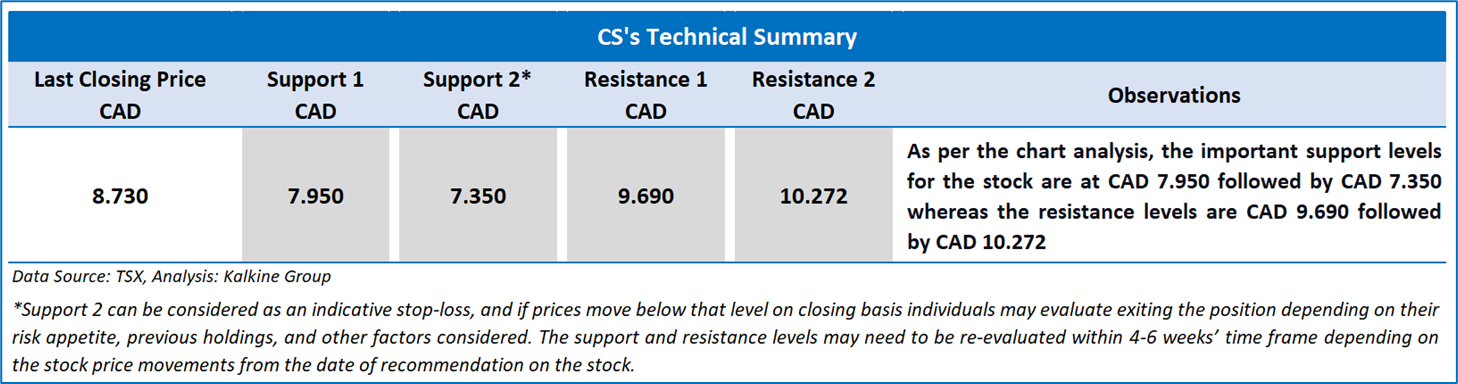
5.1 Price Performance and Technical Summary:

The stock has witnessed a downside of ~3.42% and ~6.43% over the last 1 week and 1 month respectively. Moreover, the stock is trading above the average 52-week high price of CAD 11.51 and 52-week low price of CAD 4.40 providing an opportunity to ride the trend.
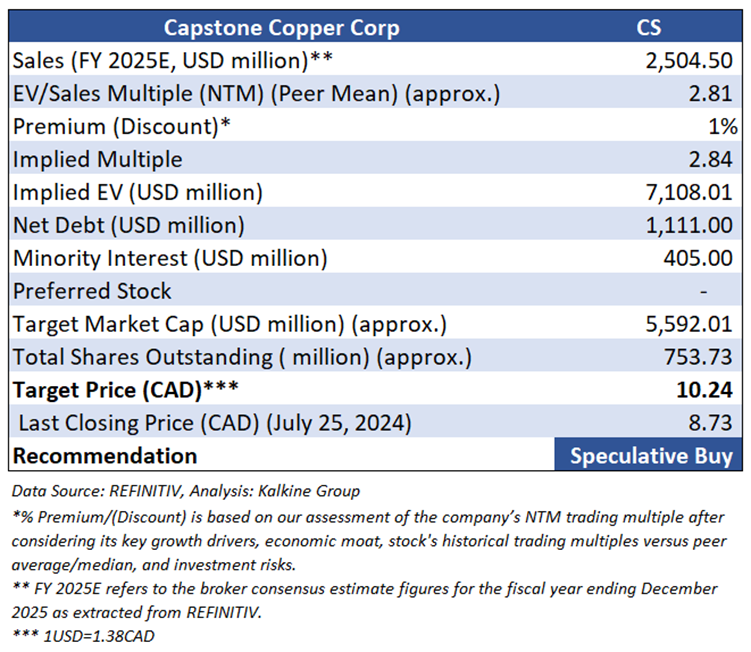
5.2 Fundamental Valuation
Valuation Methodology: EV to Sales Multiple Based Relative Valuation (Illustrative)

Markets are trading in a highly volatile zone currently due to certain macroeconomic issues and geopolitical tensions prevailing. Therefore, it is prudent to follow a cautious approach while investing.
Note 1: Past performance is not a reliable indicator of future performance.
Note 2: The reference date for all price data, currency, technical indicators, support, and resistance levels is July 25, 2024. The reference data in this report has been partly sourced from REFINITIV.
Note 3: Investment decisions should be made depending on an individual's appetite for upside potential, risks, holding duration, and any previous holdings. An 'Exit' from the stock can be considered if the Target Price mentioned as per the Valuation and or the technical levels provided has been achieved and is subject to the factors discussed above.
Note 4: Dividend Yield may vary as per the stock price movement.
Technical Indicators Defined: -
Support: A level at which the stock prices tend to find support if they are falling, and a downtrend may take a pause backed by demand or buying interest. Support 1 refers to the nearby support level for the stock and if the price breaches the level, then Support 2 may act as the crucial support level for the stock.
Resistance: A level at which the stock prices tend to find resistance when they are rising, and an uptrend may take a pause due to profit booking or selling interest. Resistance 1 refers to the nearby resistance level for the stock and if the price surpasses the level, then Resistance 2 may act as the crucial resistance level for the stock.
Stop-loss: It is a level to protect further losses in case of unfavourable movement in the stock prices.
The advice given by Kalkine Canada Advisory Services Inc. and provided on this website is general information only and it does not take into account your investment objectives, financial situation and the particular needs of any particular person. You should therefore consider whether the advice is appropriate to your investment objectives, financial situation and needs before acting upon it. You should seek advice from a financial adviser, stockbroker or other professional (including taxation and legal advice) as necessary before acting on any advice. Not all investments are appropriate for all people. The website www.kalkine.ca is published by Kalkine Canada Advisory Services Inc. The link to our Terms & Conditions has been provided please go through them. On the date of publishing this report (mentioned on the website), employees and/or associates of Kalkine do not hold positions in any of the stocks covered on the website. These stocks can change any time and readers of the reports should not consider these stocks as advice or recommendations later.
 Please wait processing your request...