
Section 1: Company Overview and Fundamentals
1.1 Company Overview:
Clearway Energy, Inc. (NYSE: CWEN) is a renewable energy company. The Company is an energy infrastructure investor and owner of long-term contracted assets across North America. Its segments include Conventional and Renewables. The Company's businesses are segregated based on conventional power generation, and renewable businesses, which consist of solar and wind.
Kalkine’s Dividend Income Report covers the Company Overview, Key positives & negatives, investment summary, Business updates and insights into company recent financial results, Key Risks & Outlook, Price performance and technical summary, Target Price, and Recommendation on the stock.
Stock Performance:
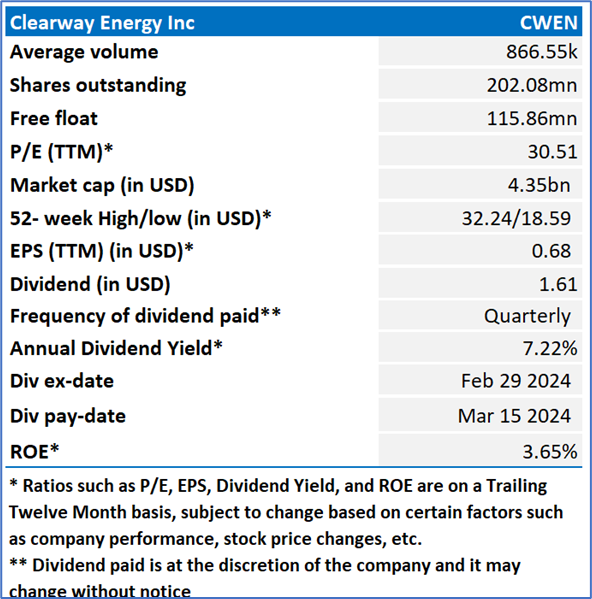
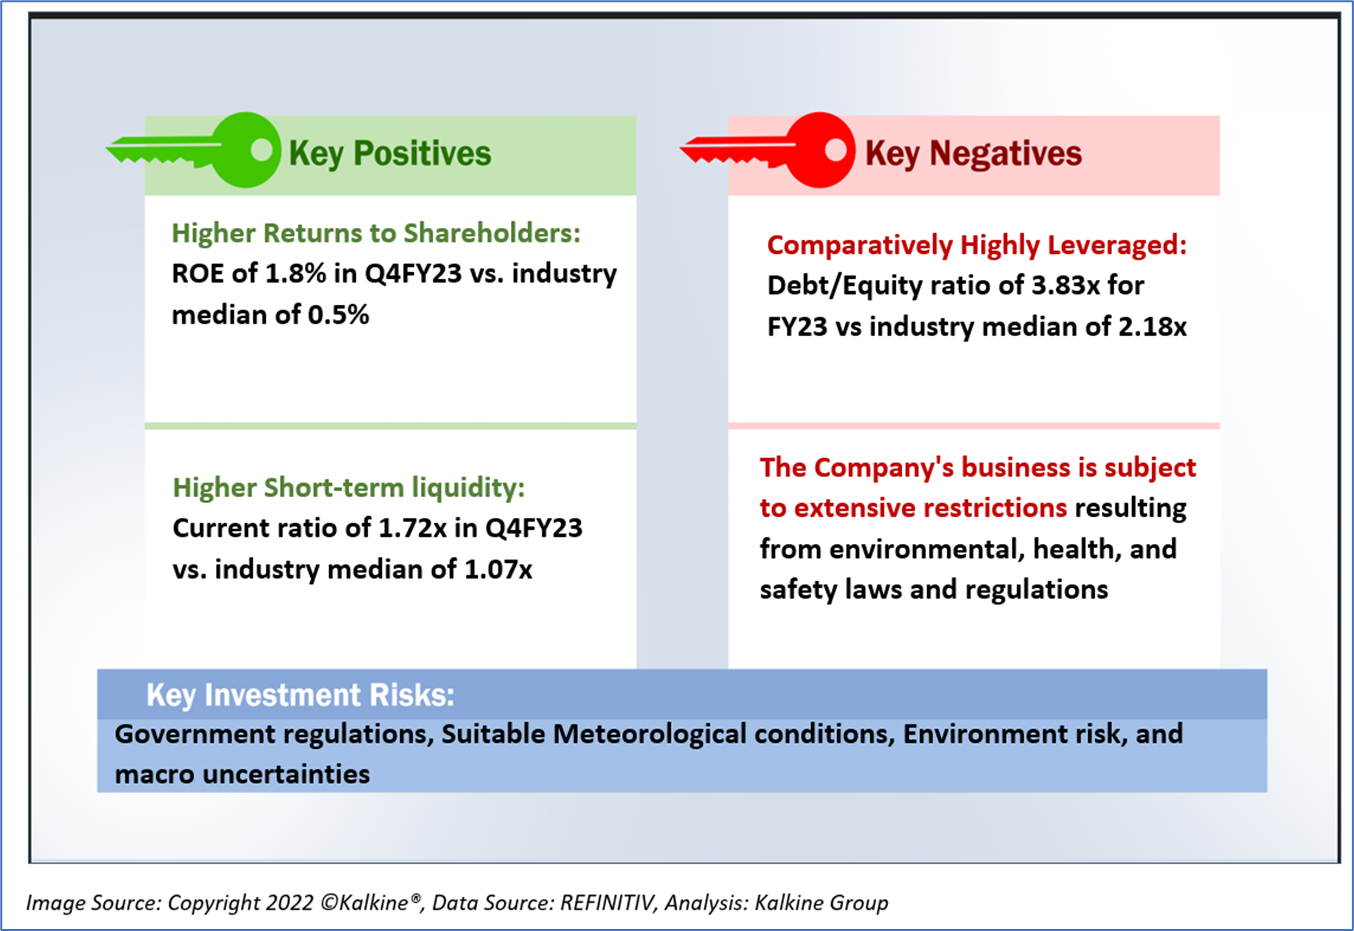
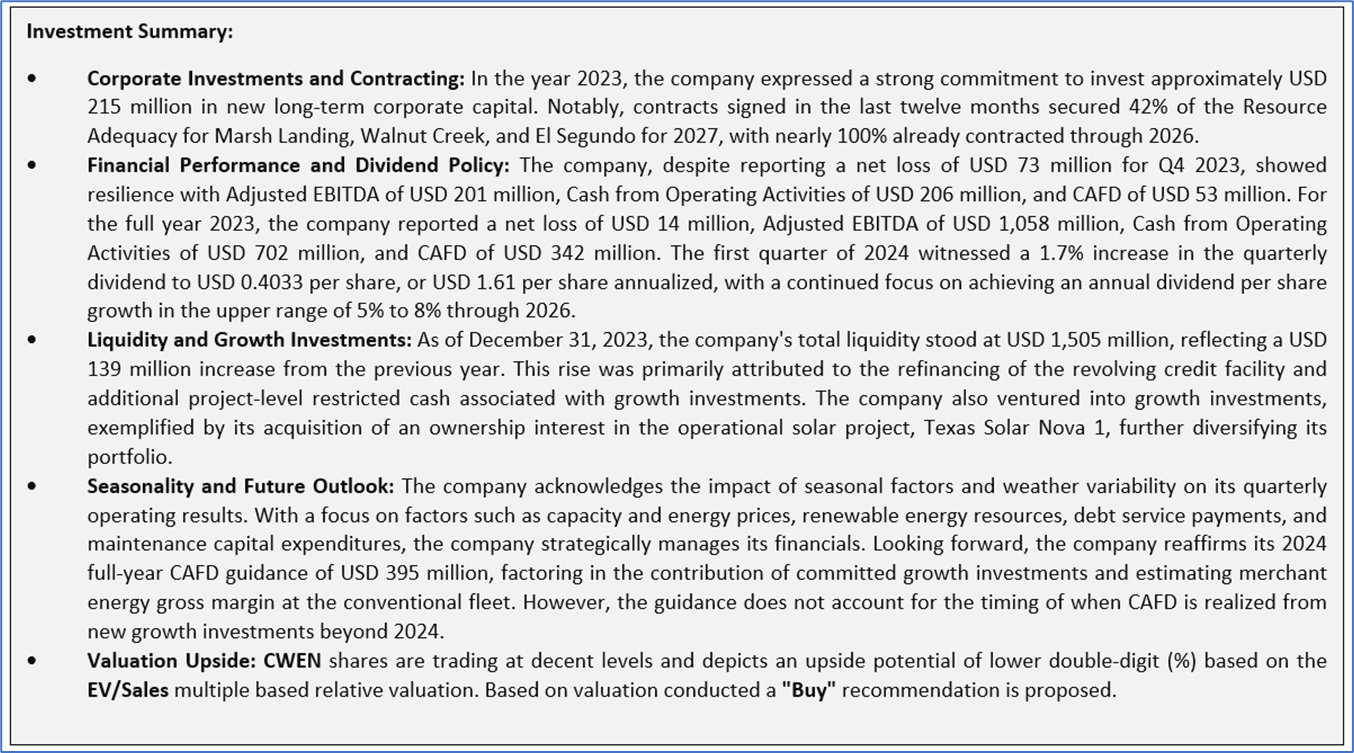
1.2 The Key Positives, Negatives, and Investment summary
1.3 Key Metrics:
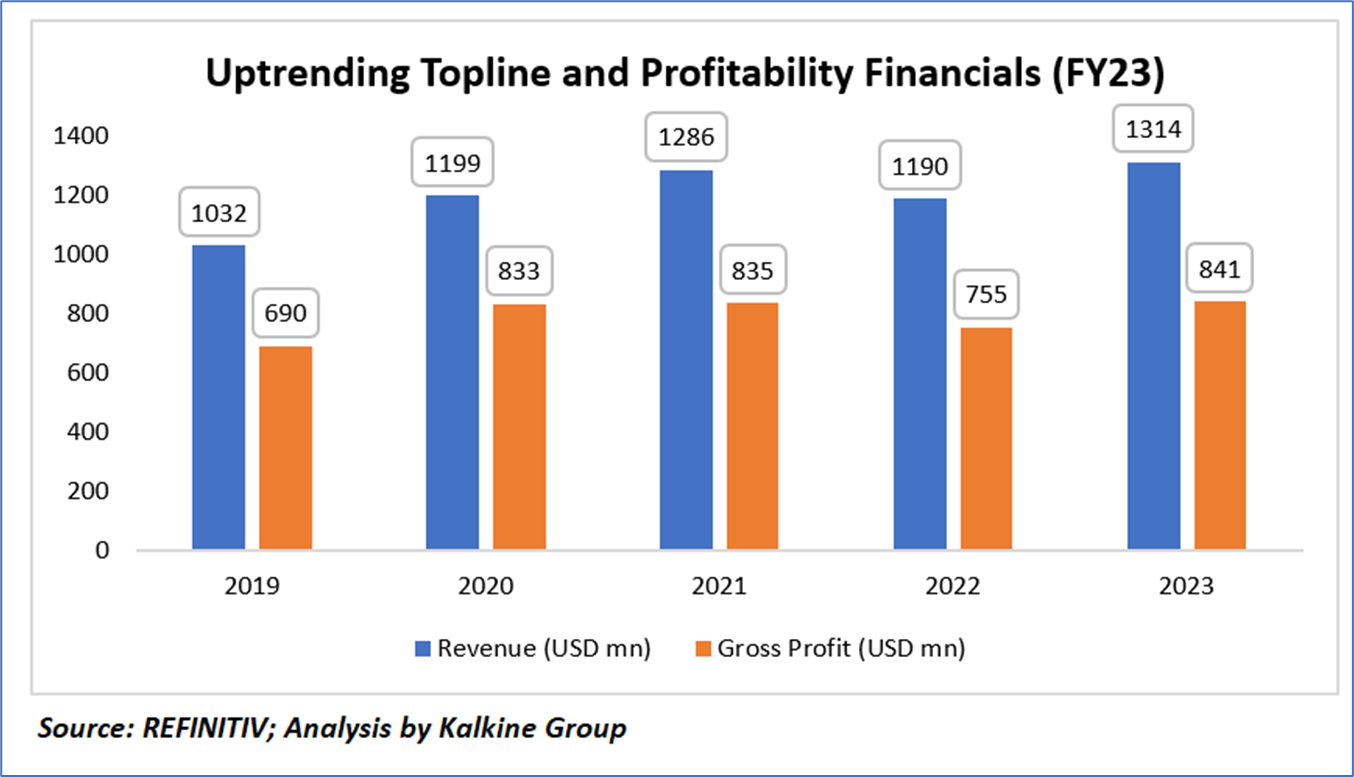
Clearway Energy, Inc. (CWEN) exhibited a dynamic financial performance from 2019 to 2023. The company experienced a steady rise in revenue during this period, reaching USD 1314 million in 2023 after a slight contraction in 2022. Notably, the gross profit trend demonstrated consistent growth, with figures increasing from USD 690 million in 2019 to USD 841 million in 2023. Although 2022 witnessed a marginal dip in gross profit to USD 755 million, the subsequent year saw a substantial recovery, highlighting the company's resilience. The overall analysis indicates Clearway Energy's ability to navigate challenges and adapt, showcasing a positive trajectory and positioning itself for continued success in the renewable energy sector. The financial data underscores the company's robustness and strategic management, providing stakeholders with valuable insights into its performance and growth potential.
1.4 Top 10 shareholders:
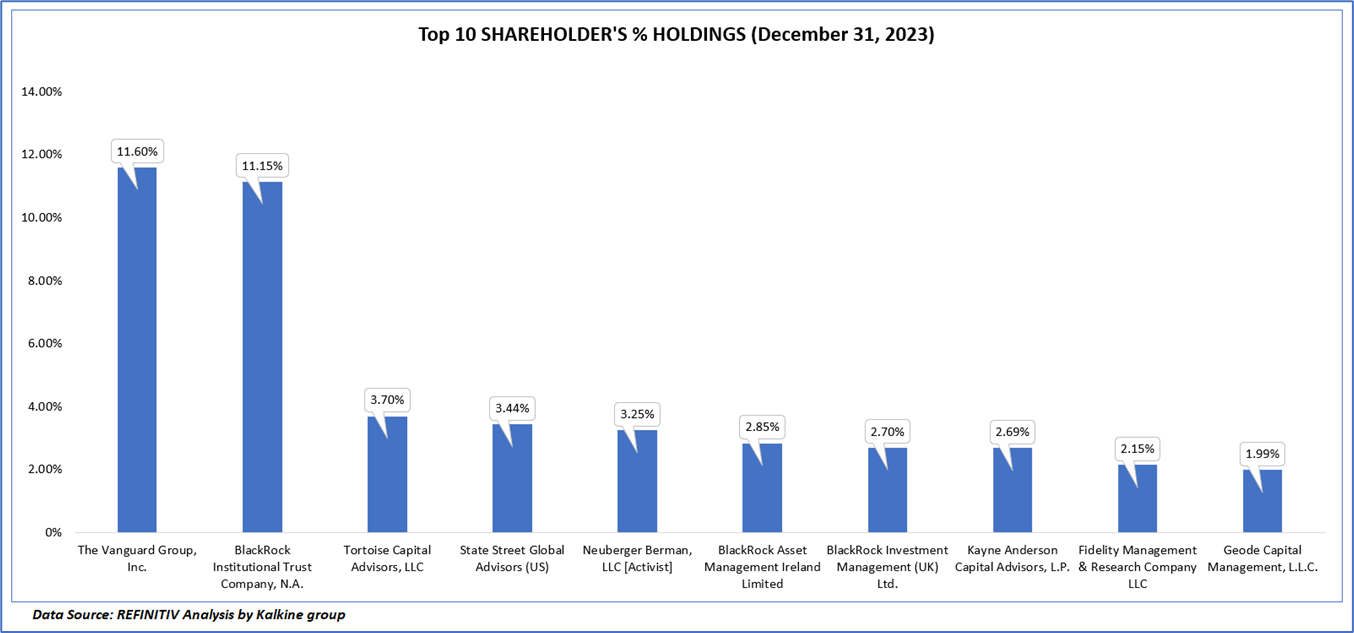
The top 10 shareholders together form ~45.51% of the total shareholding, signifying diverse shareholding. The Vanguard Group, Inc, and BlackRock Institutional Trust Company, N.A. are the biggest shareholders, holding the maximum stake in the company at ~11.60% and ~11.15%, respectively.
1. 5 Consistent dividend History
CWEN has been paying dividends since 2015, CWEN has a track record of consistent dividend payments with a current dividend yield of 7.22%. '
Clearway Energy, Inc. issued an official statement on February 14, 2024, disclosing that its Board of Directors has approved the declaration of a quarterly dividend for both Class A and Class C common stock. The declared dividend amounts to USD 0.4033 per share and is slated for payment on March 15, 2024, to shareholders recorded as of March 1, 2024. This quarterly dividend equates to USD 1.6132 per share on an annualized basis, reflecting a 1.7% augmentation compared to the fourth quarter of 2023 when the dividend stood at USD 0.3964 per share, or USD 1.5856 per share annualized.

Section 2: Business Updates and Corporate Business Highlights
2.1 Recent Updates:
The below picture gives an overview of the recent updates:

2.2 Insights of FY23:

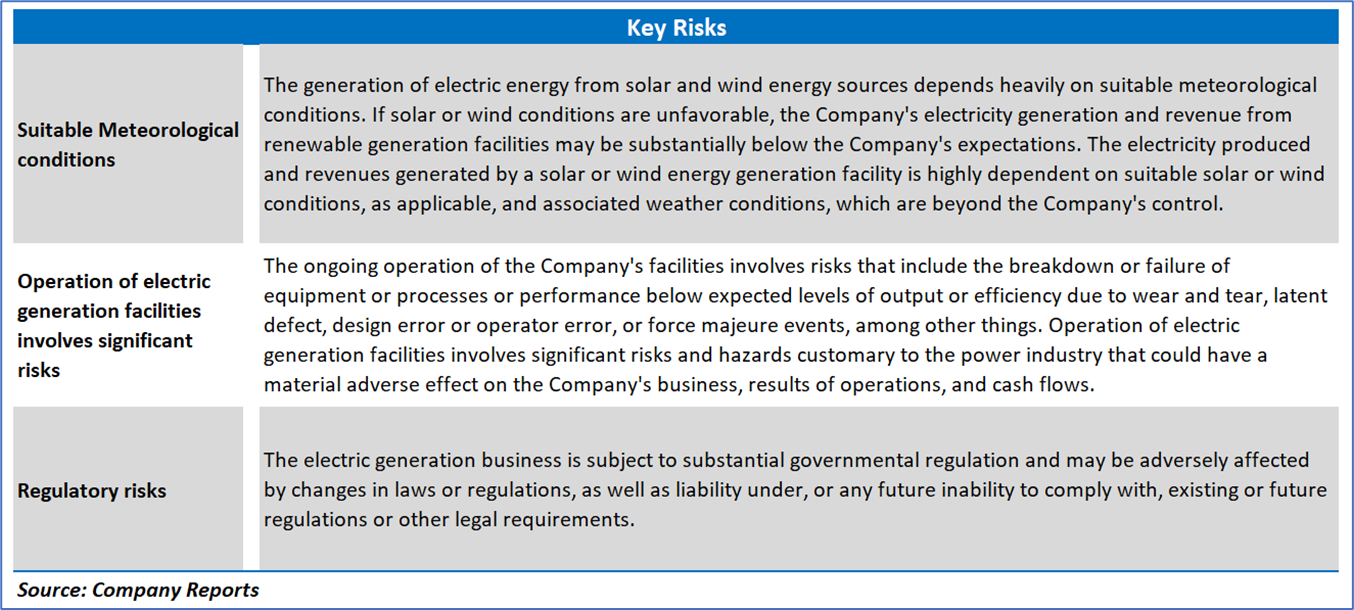
Section 3: Key Risks

Section 4: Stock Recommendation Summary:
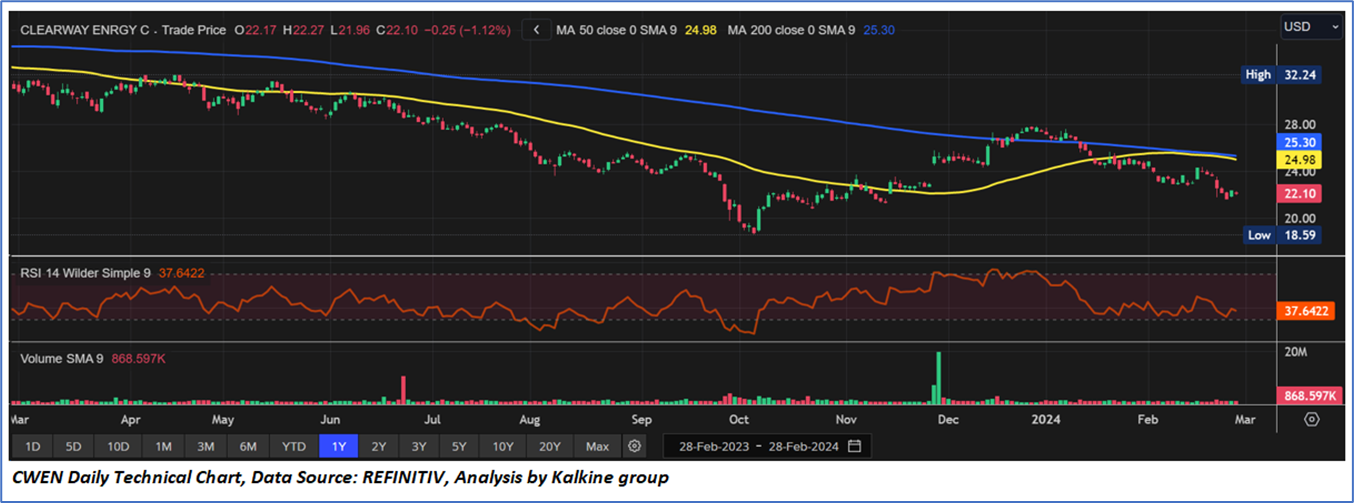
4.1 Price Performance and Technical Summary:
Stock Performance:

4.2 Fundamental Valuation
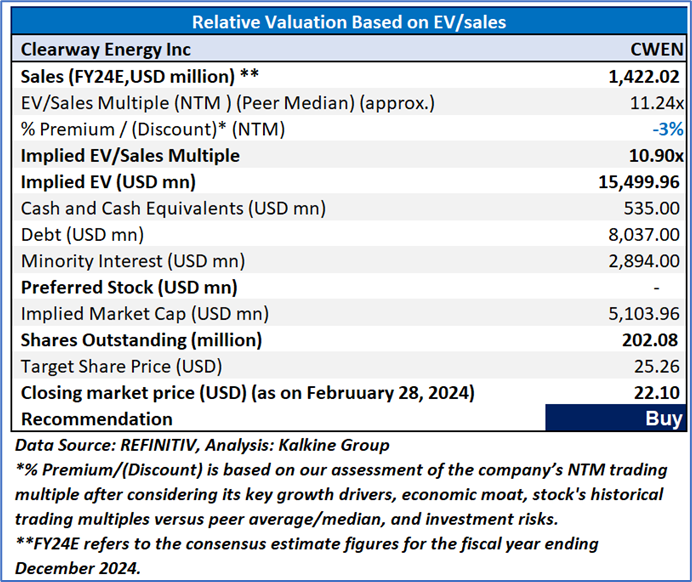
Valuation Methodology: EV/Sales per share Multiple Based Relative Valuation
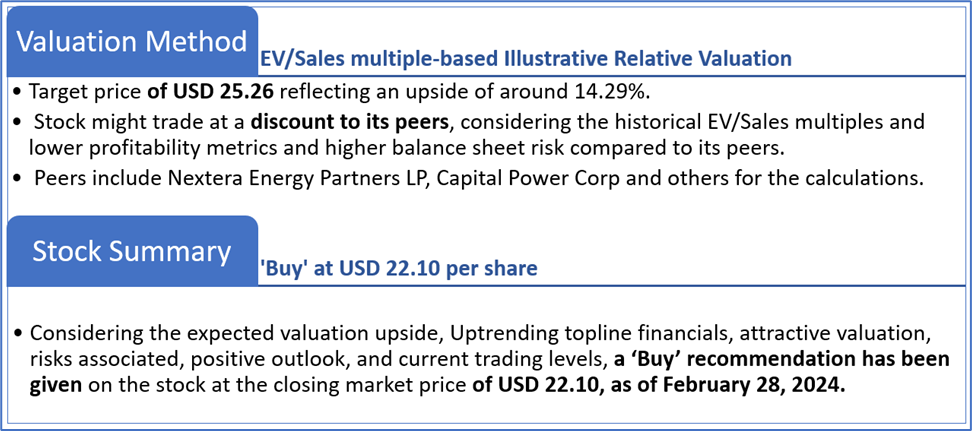
Markets are trading in a highly volatile zone currently due to certain macroeconomic issues and geopolitical tensions prevailing. Therefore, it is prudent to follow a cautious approach while investing.
Note 1: Past performance is not a reliable indicator of future performance.
Note 2: The reference date for all price data, currency, technical indicators, support, and resistance levels is February 28, 2024. The reference data in this report has been partly sourced from REFINITIV.
Note 3: Investment decisions should be made depending on an individual's appetite for upside potential, risks, holding duration, and any previous holdings. An 'Exit' from the stock can be considered if the Target Price mentioned as per the Valuation and or the technical levels provided has been achieved and is subject to the factors discussed above.
Note 4: The report publishing date is as per the Pacific Time Zone.
Technical Indicators Defined: -
Support: A level at which the stock prices tend to find support if they are falling, and a downtrend may take a pause backed by demand or buying interest. Support 1 refers to the nearby support level for the stock and if the price breaches the level, then Support 2 may act as the crucial support level for the stock.
Resistance: A level at which the stock prices tend to find resistance when they are rising, and an uptrend may take a pause due to profit booking or selling interest. Resistance 1 refers to the nearby resistance level for the stock and if the price surpasses the level, then Resistance 2 may act as the crucial resistance level for the stock.
Stop-loss: It is a level to protect against further losses in case of unfavorable movement in the stock prices.