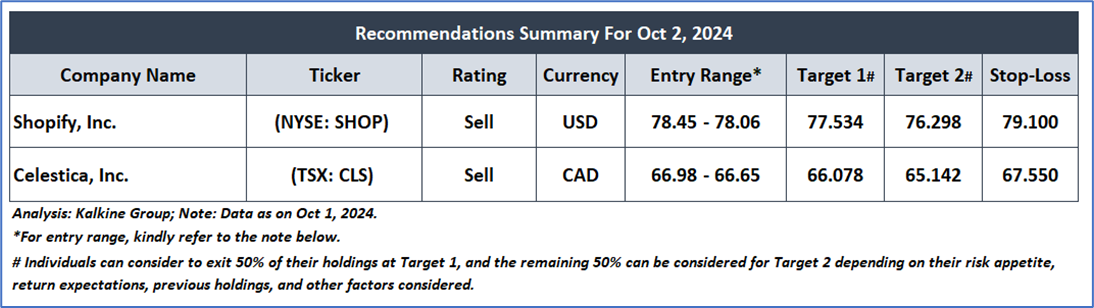
Company Overview: Shopify, Inc. (NYSE: SHOP) engages in the cloud-based commerce platform designed for small and medium-sized businesses. Celestica, Inc. (TSX: CLS) engages in the provision of supply chain solutions globally to equipment manufacturers and service providers. Report covers the Price Action, Technical Indicators Analysis along with the Target Levels, Stop Loss Level, and Recommendations on these two stocks.

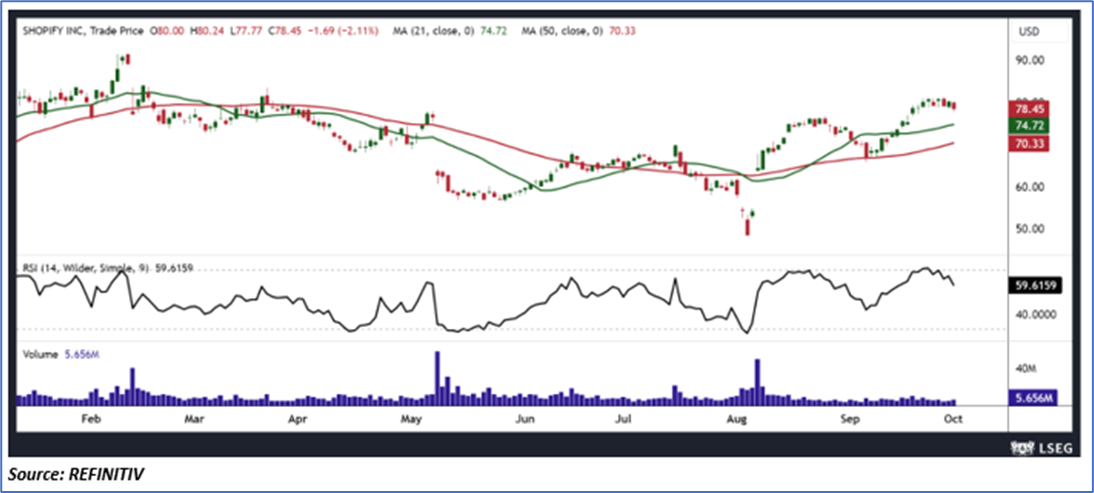
SHOP’s Technical Observation
SHOP's stock faced resistance at critical levels and dropped in the last session, indicating a possible near-term decline. The 14-day Relative Strength Index (RSI) is shifting downward from high levels, strengthening the bearish sentiment and suggesting that the stock's downward trend is expected to continue. Additionally, the stock is currently trading above its 21-day simple moving average, which raises the possibility of it falling below this level soon, potentially leading to a short-term pullback.
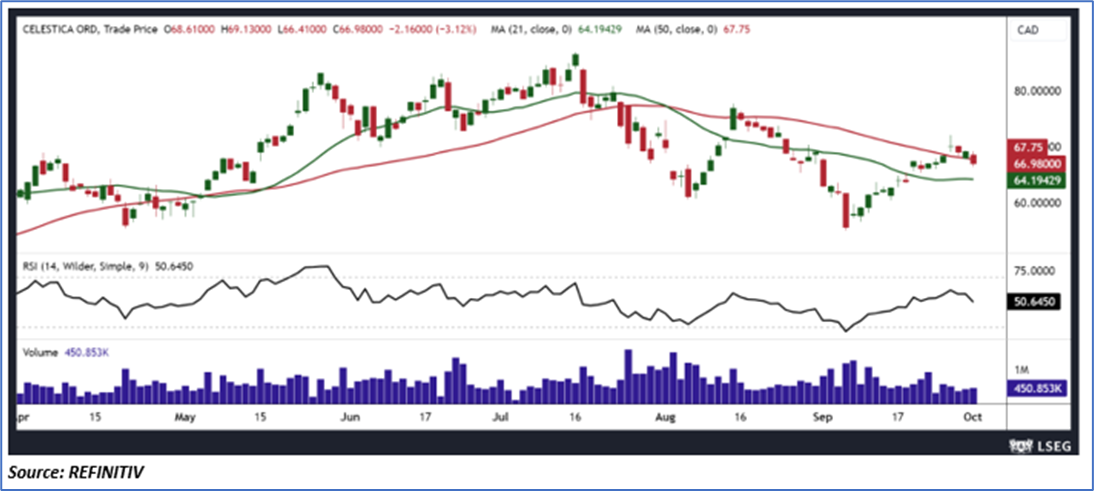
CLS’ Technical Observation
CLS' stock faced resistance at significant levels and declined in the last session, suggesting a possible near-term downturn. The 14-day Relative Strength Index (RSI) is beginning to trend downward from previously high levels, reinforcing the bearish outlook and indicating that the stock's downward momentum is likely to persist. Furthermore, the stock is close to dropping below its 50-day simple moving average, which could trigger heightened selling pressure in the short term.
Markets are trading in a highly volatile zone currently due to certain macroeconomic issues and prevailing geopolitical tensions. Therefore, it is prudent to follow a cautious approach while investing.
Related Risks: This report may be looked at from a high-risk perspective and recommendations are provided only for day trading purposes. Recommendations provided in this report are solely based on technical parameters, and the fundamental performance of the stocks has not been considered in the decision-making process. Other factors which could impact stock prices include market risks, regulatory risks, interest rates risks, currency risks, social and political instability risks etc.
Note 1: Entry Range: For the given recommendation(s), the Entry Range is based on considering a certain range (0.5% - 2%) above (in speculative buy case) or below (in sell case) of the previous day close price. A recommendation will be considered void if the prices do not test the given range levels for the particular day.
Note 2: This report's recommendation(s) is purely for day trading purposes and position(s) will be considered closed automatically at the close price of the day in case no target or stop loss level is hit. It is advisable to follow the targets and stop-loss levels strictly and exit the position accordingly, as it may lead to limitless loss if the position is not taken care of with due diligence.
How to Read the Charts?
The Green colour line reflects the 21-period moving average, while the red line indicates the 50- period moving average. SMA helps to identify existing price trends. If the prices are trading above the 21-period and 50-period moving averages, then it shows prices are currently trading in a bullish trend.
The Black colour line in the chart’s lower segment reflects the Relative Strength Index (14-Period), which indicates the strength of the price trend. A reading above 50 indicates a positive momentum, while below 50 indicates a negative momentum. A reading of 70 or above suggests overbought status, while a reading of 30 or below suggests an oversold status.
The Blue colour bars in the chart’s lower segment show the volume of the stock. The volume is the number of shares that changed hands during a given day. Stocks with high volumes are more liquid than stocks with lesser volumes, and higher liquidity in stocks helps in easier and faster execution of the order.
The Orange colour lines are the trend lines drawn by connecting two or more price points and are used for trend identification purposes. The trend lines also act as a line of support and resistance.
Stop-loss: It is a level to protect further losses in case of unfavourable movement in the stock prices.
The reference date for all price data, currency, technical indicators, support, and resistance levels Oct 1, 2024. The reference data in this report has been partly sourced from REFINITIV.
Abbreviations
CMP: Current Market Price
SMA: Simple Moving Average
RSI: Relative Strength Index
USD: United States dollar
Note: Trading decisions require a thorough analysis by individuals. The technical analysis reports generally chart out metrics that individuals may assess before any stock evaluation. The above are illustrative analytical factors used for evaluating the stocks; other parameters can be looked at along with additional risks per se. Past performance is neither an indicator nor a guarantee of future performance.
The advice given by Kalkine Canada Advisory Services Inc. and provided on this website is general information only and it does not take into account your investment objectives, financial situation and the particular needs of any particular person. You should therefore consider whether the advice is appropriate to your investment objectives, financial situation and needs before acting upon it. You should seek advice from a financial adviser, stockbroker or other professional (including taxation and legal advice) as necessary before acting on any advice. Not all investments are appropriate for all people. The website www.kalkine.ca is published by Kalkine Canada Advisory Services Inc. The link to our Terms & Conditions has been provided please go through them. On the date of publishing this report (mentioned on the website), employees and/or associates of Kalkine do not hold positions in any of the stocks covered on the website. These stocks can change any time and readers of the reports should not consider these stocks as advice or recommendations later.
 Please wait processing your request...