
Section 1: Company Overview and Fundamentals
1.1 Company Overview:
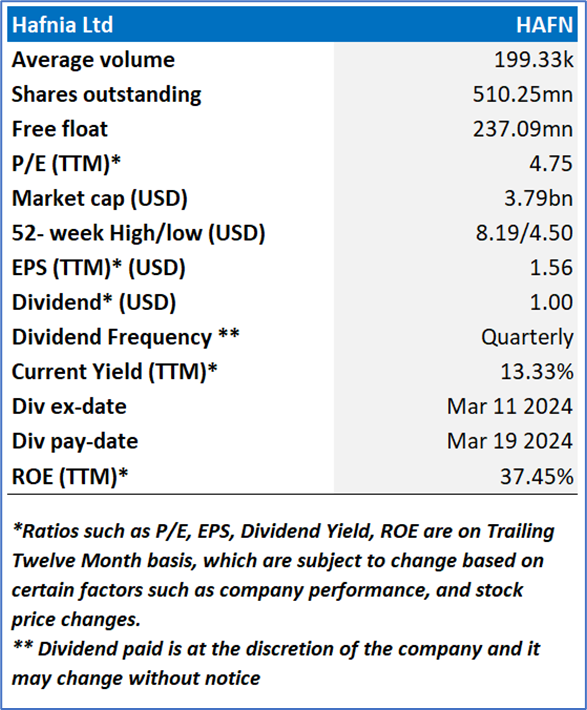
Hafnia Limited (NYSE: HAFN) is an investment holding company. The Company is an operator of products and chemical tankers. The Company offers a fully integrated shipping platform, including technical management, commercial and chartering services, pool management, and a large-scale bunker desk. The Company segments include Long Range II (LR2), Long Range I (LR1), Medium Range (MR), and Handy size (Handy), Chemical - Stainless, Chemical - Handy, and Chemical - MR.
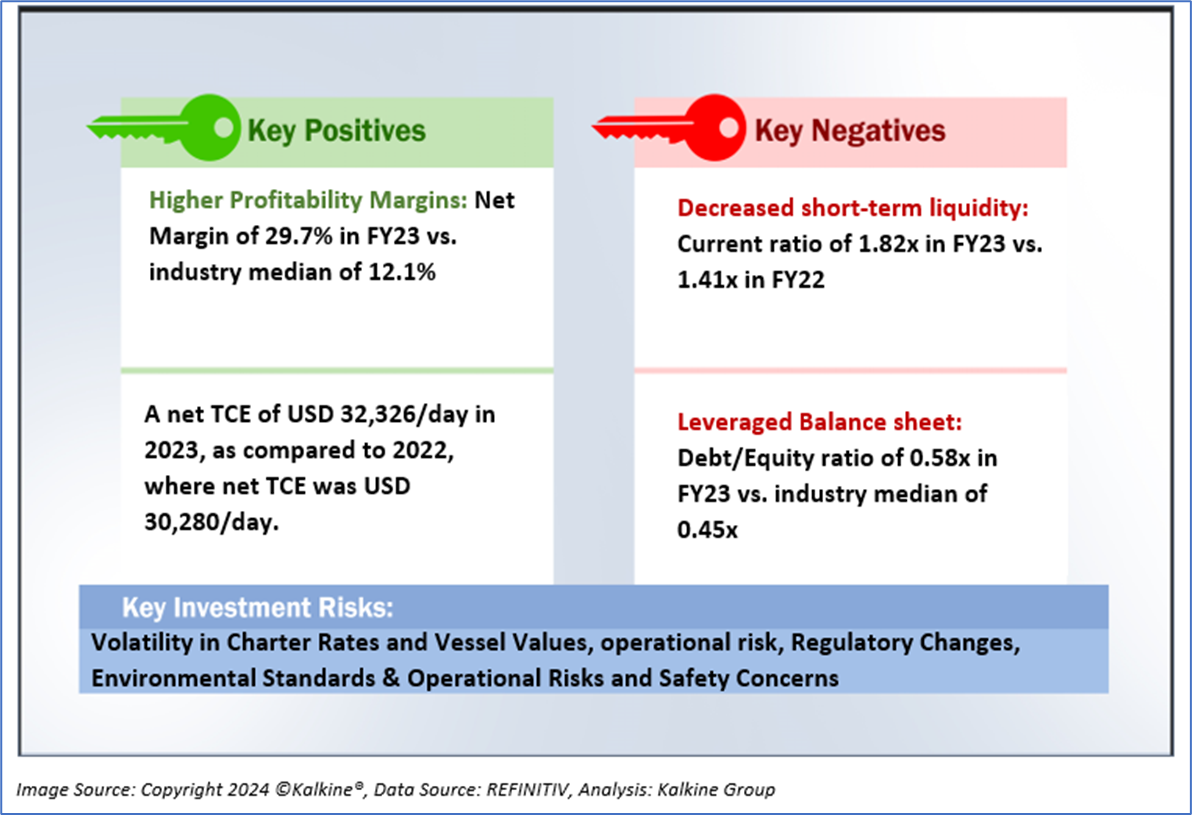
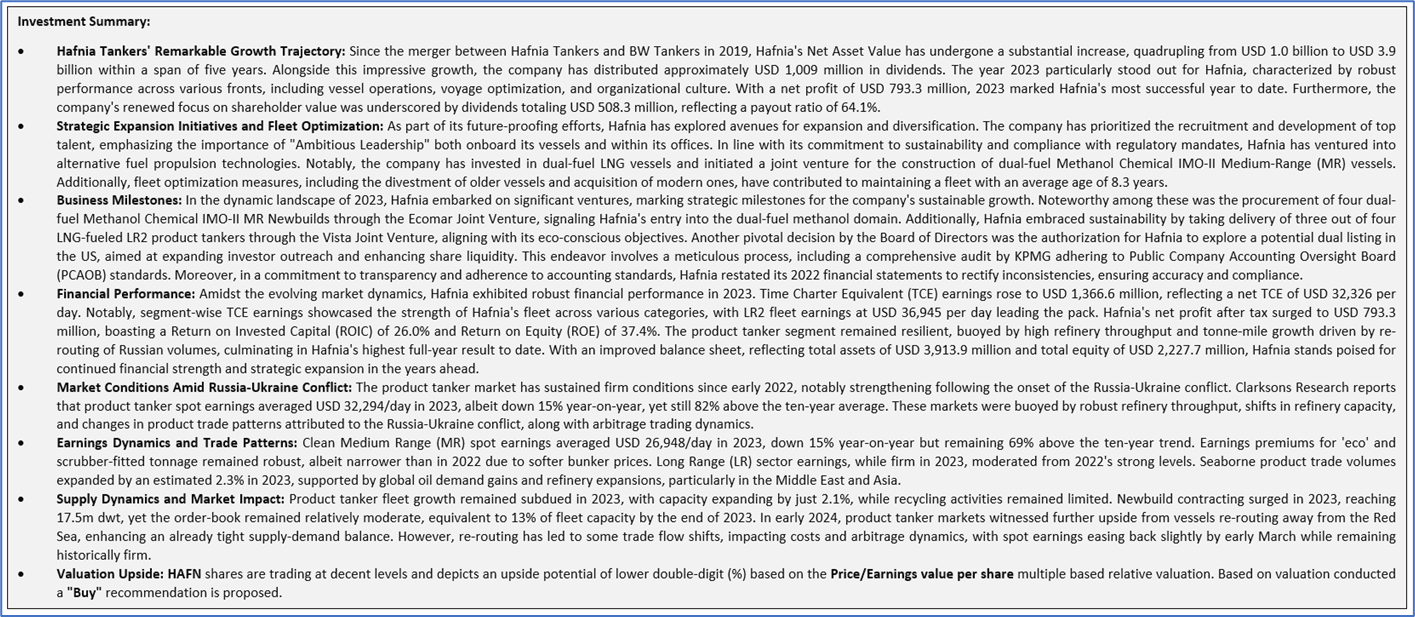
Kalkine’s Dividend Income Report covers the Company Overview, Key positives & negatives, Investment summary, Key investment metrics, Top 10 shareholding, Business updates and insights into company recent financial results, Key Risks & Outlook, Price performance and technical summary, Target Price, and Recommendation on the stock.
1.2 The Key Positives, Negatives, and Investment summary
1.3 Top 10 shareholders:
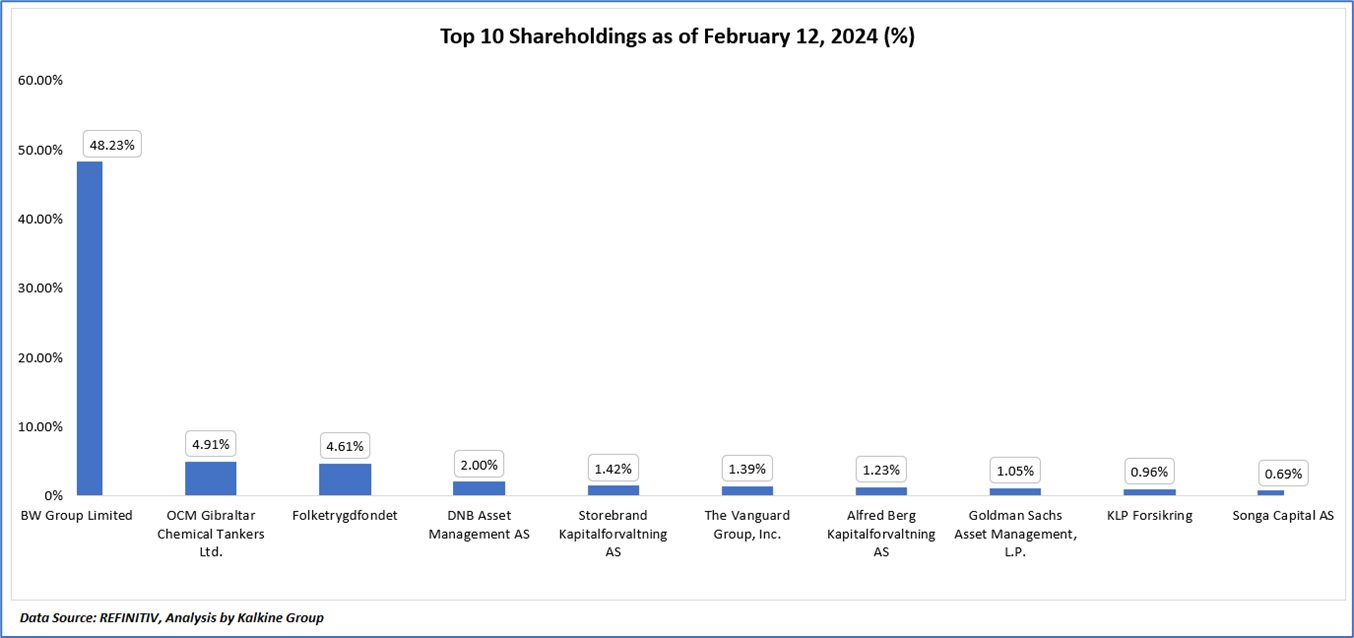
The top 10 shareholders together form ~66.49% of the total shareholding, signifying diverse shareholding. BW Group Limited, and OCM Gibraltar Chemical Tankers Ltd., are the biggest shareholders, holding the maximum stake in the company at ~48.23% and ~4.91%, respectively.
1.4 Consistent dividend payments with impressive dividend yield:
Hafnia consistently enhances shareholder value through initiatives aimed at improving share liquidity and offering robust dividend yields. In 2023, the company demonstrated its commitment to shareholders by delivering a total shareholder return of 51%. Notably, Hafnia paid out dividends totaling USD 508.3 million from its FY2023 results, representing a payout ratio of 64%. Despite this significant dividend payout, Hafnia experienced a decrease in total shareholders' equity, which stood at USD 1,500.4 million as of December 31, 2023, compared to USD 1,670.2 million at the end of the previous year, primarily due to increased dividends paid out.
The Board of Directors declared a final dividend of USD 0.2431 per share for the financial year ended December 31, 2023, totaling USD 123.5 million. Additionally, total interim dividends paid in FY2023 amounted to USD 0.7595 per share, or USD 384.9 million. It's worth noting that under the Bermuda Companies Act, dividend payments must adhere to stringent guidelines ensuring the company's financial stability. Throughout 2023, dividend payments totaling USD 534.4 million were settled by a subsidiary on behalf of Hafnia, aligning with regulatory provisions. These intercompany transactions involving dividend payments underscore Hafnia's commitment to maintaining sound financial practices while ensuring dividends are settled in accordance with regulatory requirements.
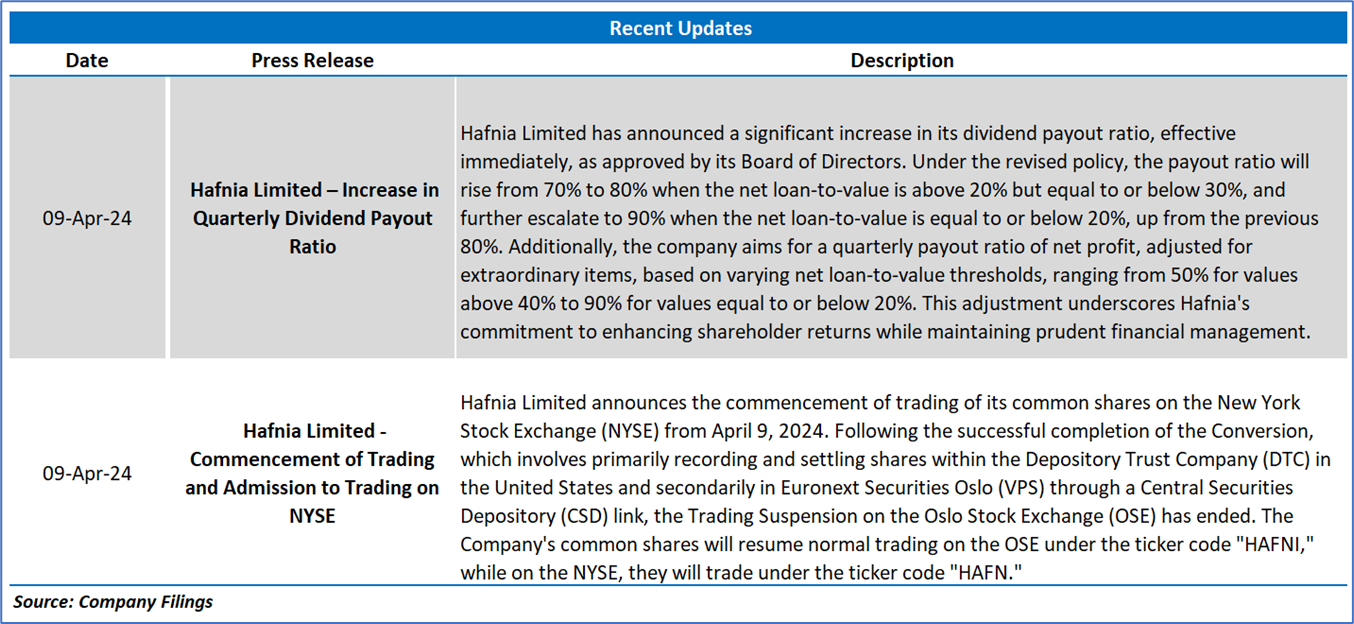
Hafnia Limited has recently announced a significant adjustment to its dividend payout policy, approved by its Board of Directors. Effective immediately, the company will increase its payout ratio from 70% to 80% when the net loan-to-value ranges between above 20% and equal to or below 30%. Moreover, when the net loan-to-value is equal to or below 20%, the payout ratio will be further elevated to 90%, up from the previous 80%. This meticulous restructuring of the dividend policy aims to align with Hafnia's financial objectives, aiming to strike a delicate balance between enhancing shareholder value and ensuring adequate resources for debt repayments and potential future investments while minimizing the exposure to unnecessary debt risks.
1.5 Key Metrics
HAFN's financial performance in fiscal year 2023 (FY23) outstripped industry medians across key metrics. Notably, its operating margin stood at 32.1%, surpassing the industry median of 27.6%. Similarly, HAFN's pretax margin and net margin were notably higher than industry benchmarks, reaching 29.9% and 29.7%, respectively, compared to industry medians of 23.4% and 12.1%. Furthermore, HAFN demonstrated robust revenue growth over the past five years, with figures rising from USD 828 million in 2019 to USD 2,672 million in FY23. Likewise, its net profit surged from USD 72 million in 2019 to USD 793 million in FY23, showcasing a consistent upward trajectory, albeit with fluctuations in certain years such as 2021, where a net loss was incurred.

1.6 Sustained Growth and Market Dynamics in the Product Tanker Sector:
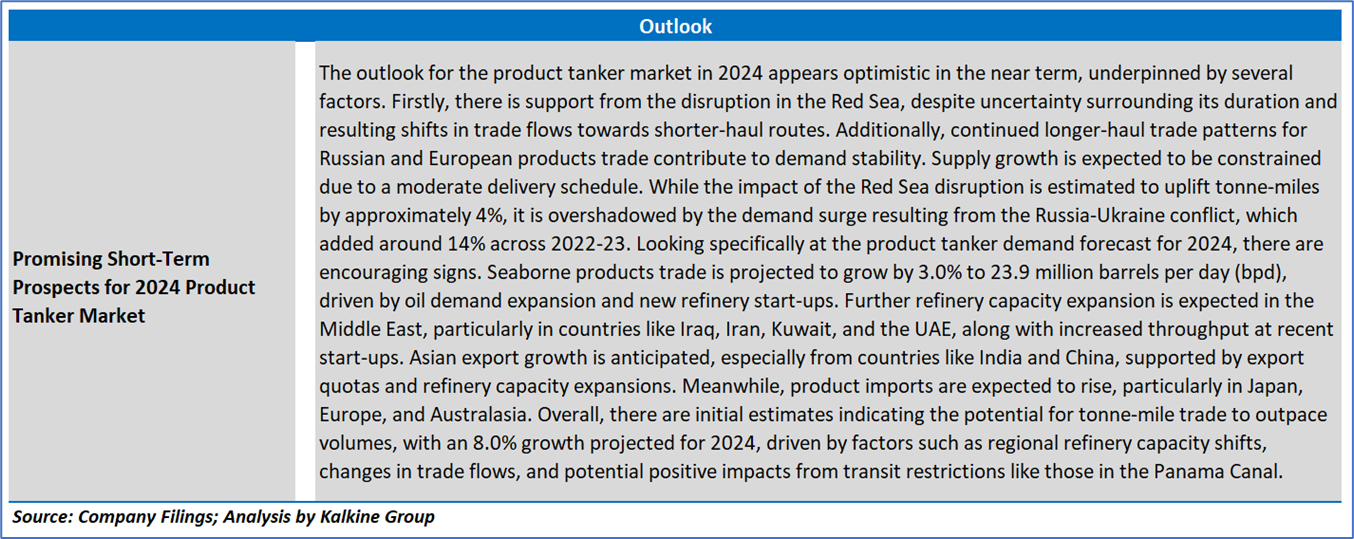
Amidst an extended period of robust market conditions, the product tanker sector has witnessed remarkable growth, with Medium Range (MR) spot earnings averaging USD 26,948/day in 2023, doubling the average since 2000. Further bolstered by disruptions in the Red Sea into early 2024, vessels re-routing away from the region have provided additional impetus. A surge in demand for product tankers has ensued, fueled by continued longer-haul trade patterns for Russian exports and European imports, driven by the Russia-Ukraine conflict and re-routing onto longer voyages via the Cape of Good Hope. The global seaborne products trade has expanded by an estimated 7% in 2023, supporting demand, with a projected 5% growth anticipated in 2024. Refinery capacity start-up trends have further underpinned underlying product tanker demand. Despite limited supply growth in 2023, expanding by just 2.1%, the supply backdrop is expected to remain supportive, with fleet growth of 1.2% anticipated this year. While there was an up-tick in ordering in 2023, the newbuild order-book represents a moderate 13% of fleet capacity. Additionally, emissions regulations and efforts to improve Carbon Intensity Indicator (CII) ratings could potentially moderate active tanker supply through retrofit time and reduced speeds.
Section 2: Business Updates and Financial Highlights
2.1 Recent Updates:
The below picture gives an overview of the recent updates:
2.2 Insights of FY23:

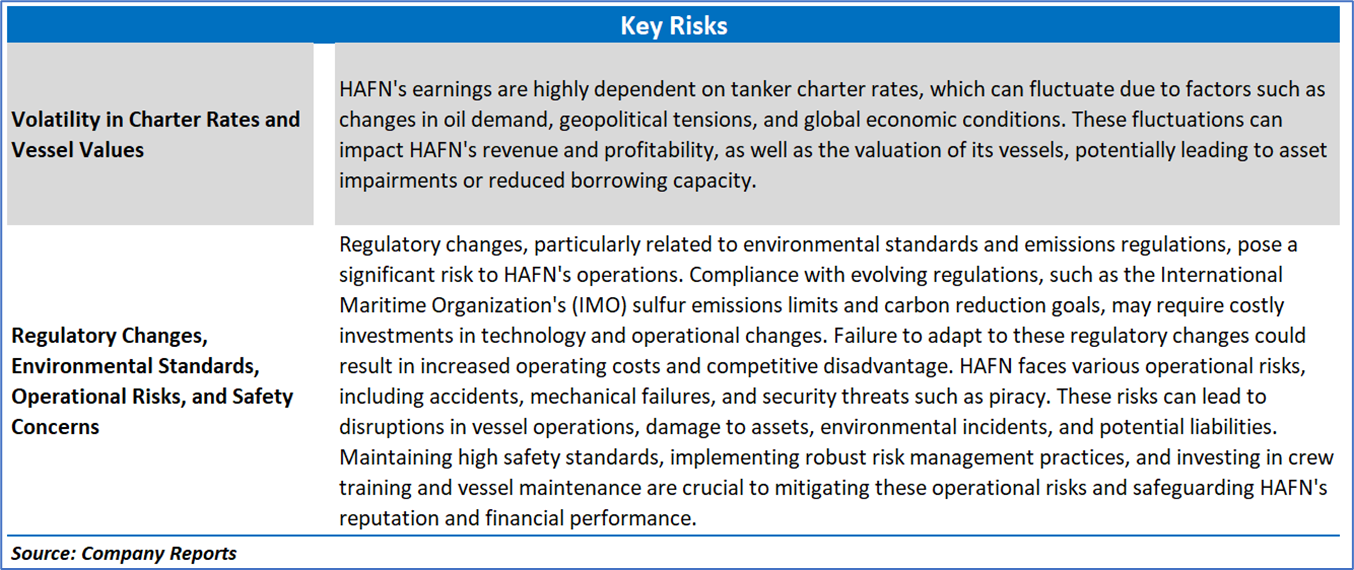
Section 3: Key Risks and Outlook:
Section 4: Stock Recommendation Summary:
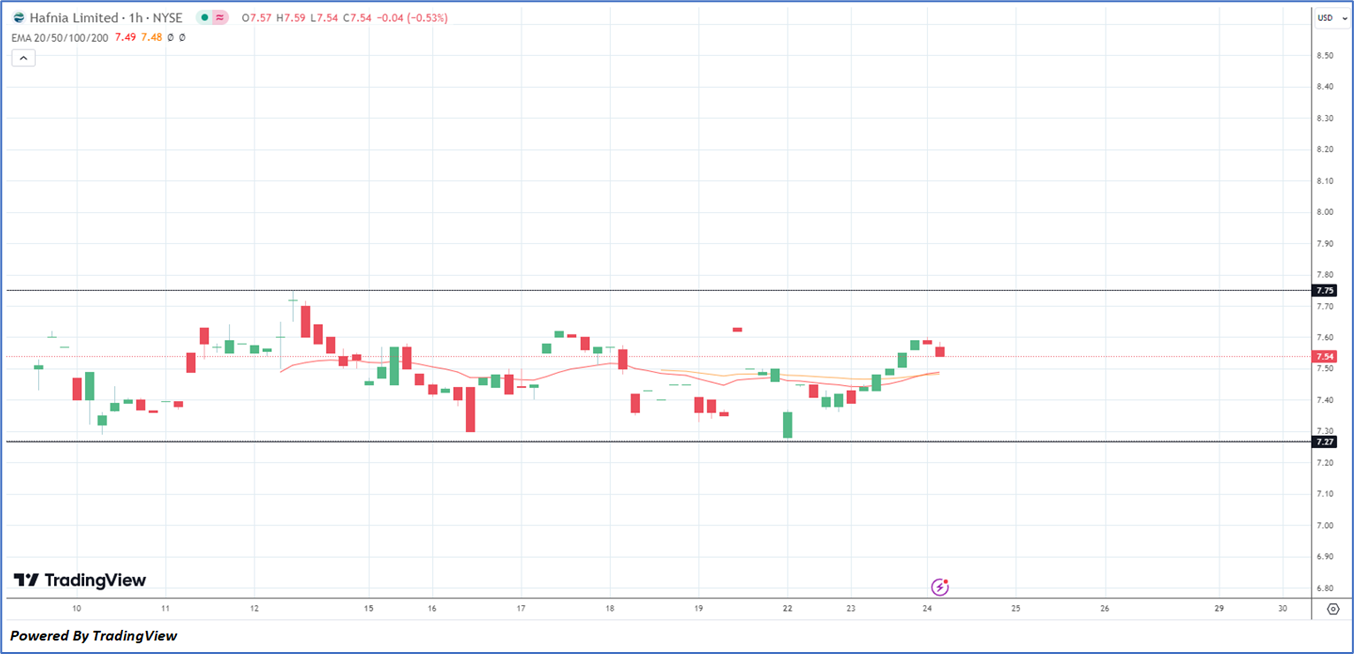
4.1 Technical Summary:

4.2 Fundamental Valuation
Valuation Methodology: Price/Earnings Per Share Multiple Based Relative Valuation
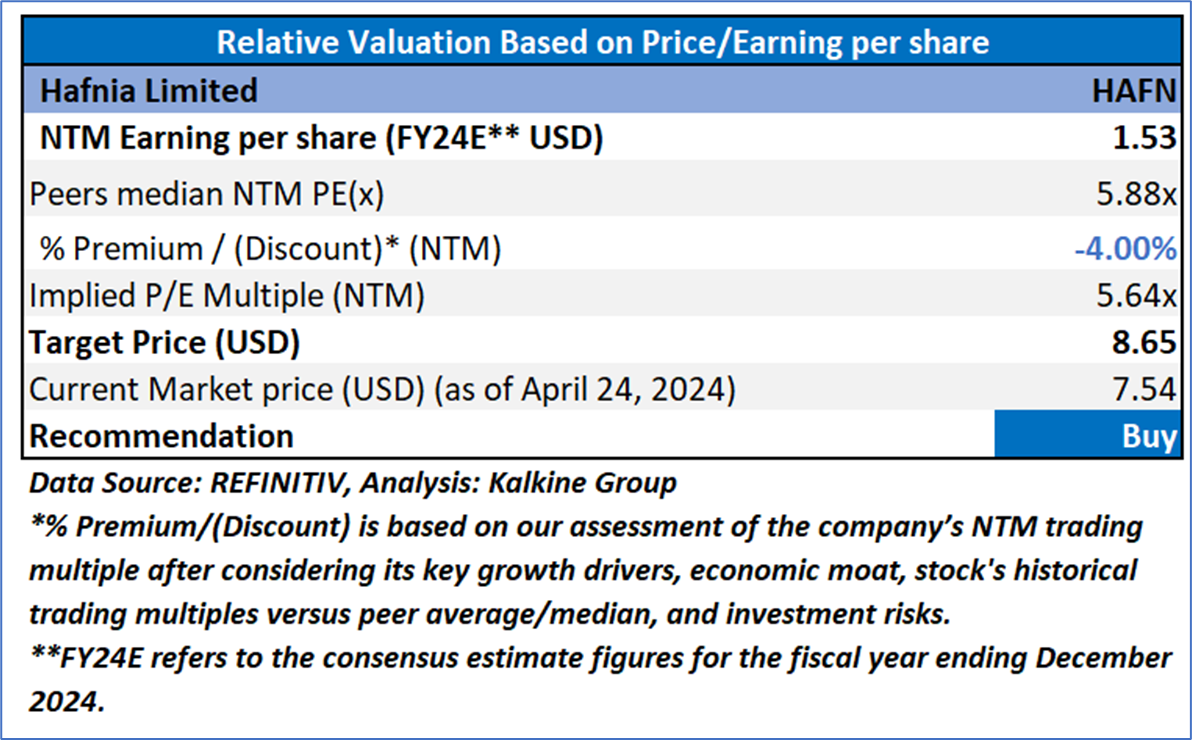
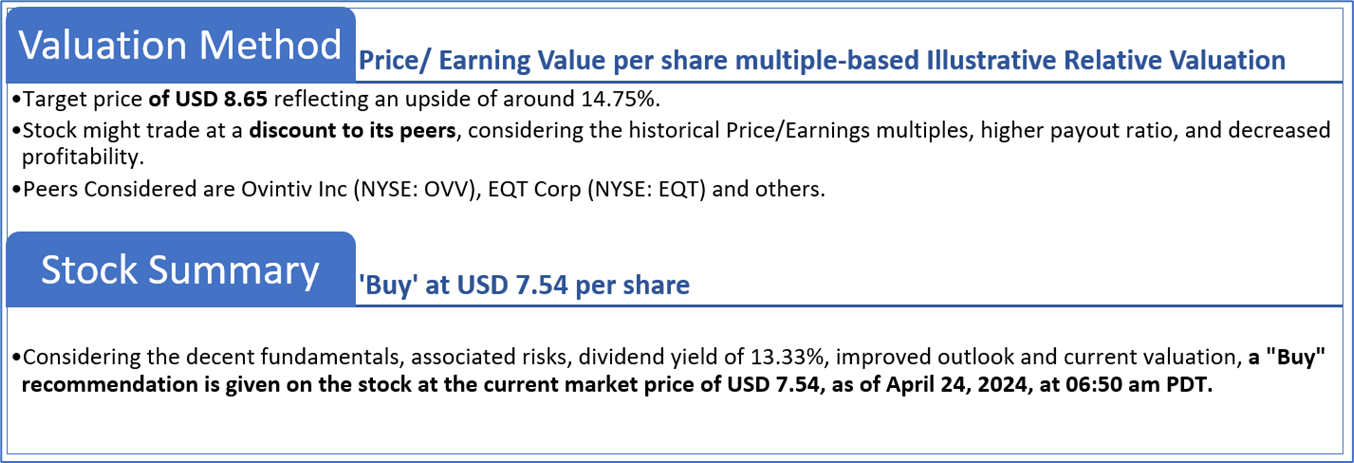
Markets are trading in a highly volatile zone currently due to certain macroeconomic issues and geopolitical tensions prevailing. Therefore, it is prudent to follow a cautious approach while investing.
Note 1: Past performance is not a reliable indicator of future performance.
Note 2: The reference date for all price data, currency, technical indicators, support, and resistance levels is April 24, 2024. The reference data in this report has been partly sourced from REFINITIV.
Note 3: Investment decisions should be made depending on an individual's appetite for upside potential, risks, holding duration, and any previous holdings. An 'Exit' from the stock can be considered if the Target Price mentioned as per the Valuation and or the technical levels provided has been achieved and is subject to the factors discussed above.
Note 4: The report publishing date is as per the Pacific Time Zone.
Technical Indicators Defined: -
Support: A level at which the stock prices tend to find support if they are falling, and a downtrend may take a pause backed by demand or buying interest. Support 1 refers to the nearby support level for the stock and if the price breaches the level, then Support 2 may act as the crucial support level for the stock.
Resistance: A level at which the stock prices tend to find resistance when they are rising, and an uptrend may take a pause due to profit booking or selling interest. Resistance 1 refers to the nearby resistance level for the stock and if the price surpasses the level, then Resistance 2 may act as the crucial resistance level for the stock.
Stop-loss: It is a level to protect against further losses in case of unfavorable movement in the stock prices.
The advice given by Kalkine Canada Advisory Services Inc. and provided on this website is general information only and it does not take into account your investment objectives, financial situation and the particular needs of any particular person. You should therefore consider whether the advice is appropriate to your investment objectives, financial situation and needs before acting upon it. You should seek advice from a financial adviser, stockbroker or other professional (including taxation and legal advice) as necessary before acting on any advice. Not all investments are appropriate for all people. The website www.kalkine.ca is published by Kalkine Canada Advisory Services Inc. The link to our Terms & Conditions has been provided please go through them. On the date of publishing this report (mentioned on the website), employees and/or associates of Kalkine do not hold positions in any of the stocks covered on the website. These stocks can change any time and readers of the reports should not consider these stocks as advice or recommendations later.