
Section 1: Company Overview and Fundamentals
1.1 Company Overview:
LexinFintech Holdings Ltd. (NASDAQ: LX) is a holding company. The Company is primarily engaged in providing online direct sales services and online consumer finance services. The Company's online consumer finance platform, Fenqile, offers customers personal installment loans, installment purchase loans and other loan products.
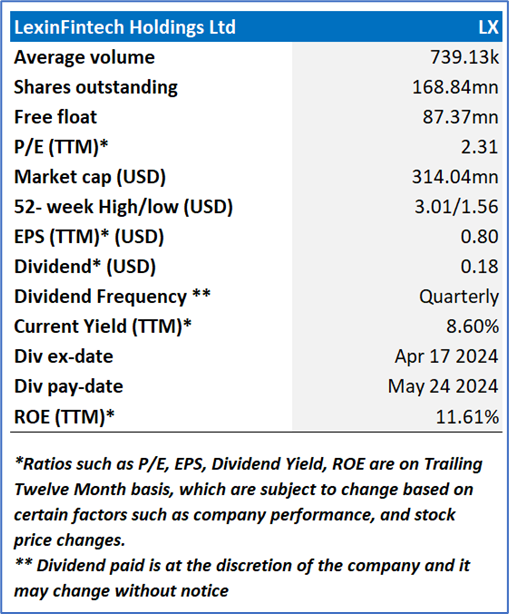
Kalkine’s Dividend Income Report covers the Company Overview, Key positives & negatives, Investment summary, Key investment metrics, Top 10 shareholding, Business updates and insights into company recent financial results, Key Risks & Outlook, Price performance and technical summary, Target Price, and Recommendation on the stock.
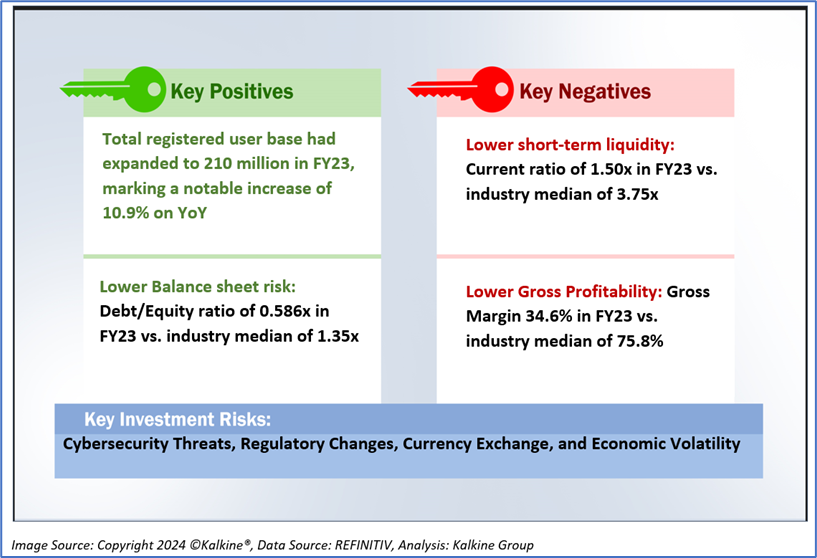
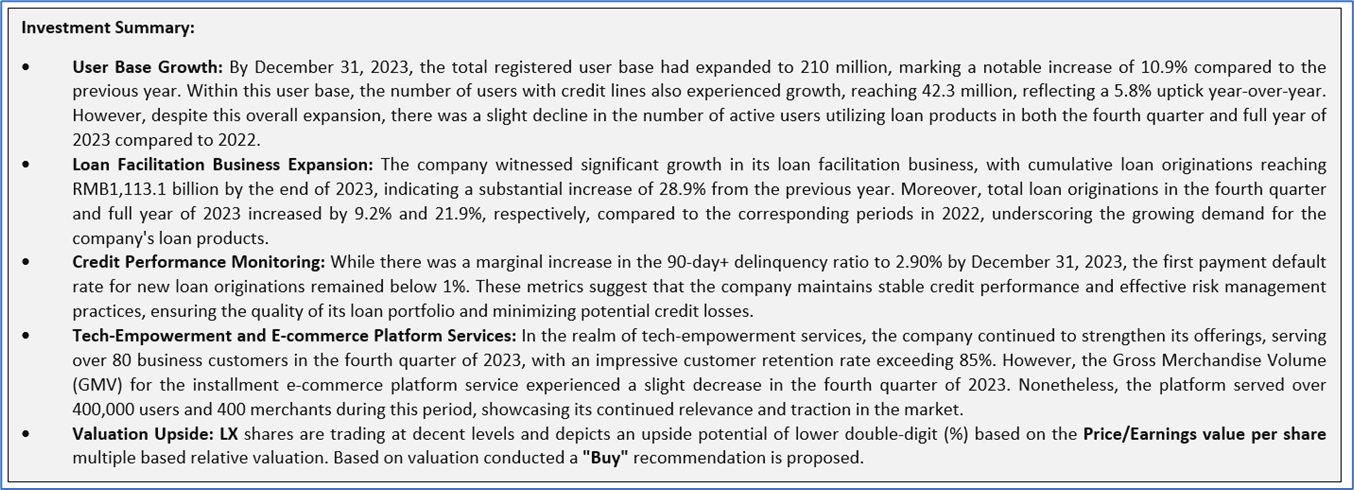
1.2 The Key Positives, Negatives, and Investment summary
1.3 Top 10 shareholders:
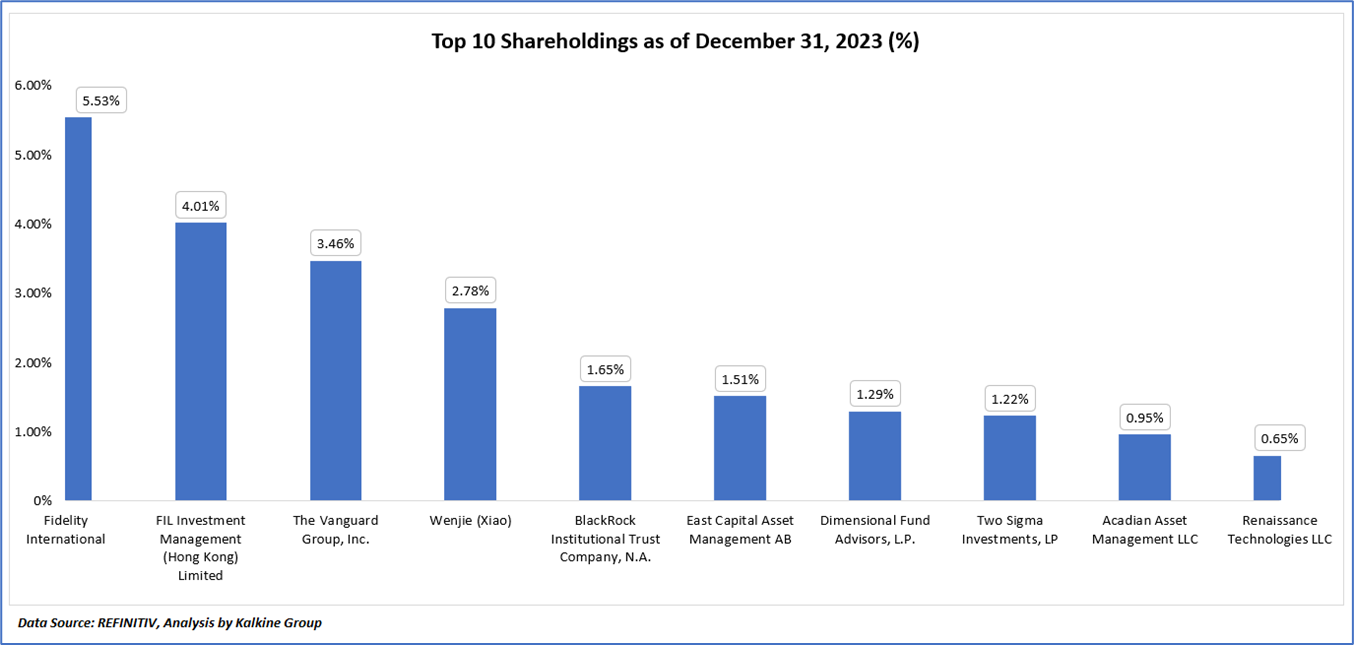
The top 10 shareholders together form ~23.06% of the total shareholding, signifying diverse shareholding. Fidelity International, and FIL Investment Management (Hong Kong) Limited, are the biggest shareholders, holding the maximum stake in the company at ~5.53% and ~4.01%, respectively.
1.4 Dividend payments with impressive dividend yield:
The board of directors of the Company has approved a semi-annual dividend of USD 0.033 per ordinary share, or USD 0.066 per ADS, for the six-month period ending on December 31, 2023, in accordance with the established dividend policy. The dividend payment is slated for May 24, 2024, and will be distributed to shareholders of record, including ADS holders, as of April 18, 2024, as per New York time.
In outlining the strategic outlook for 2024, the spokesperson highlighted the importance of maintaining a balanced approach to sustain growth and manage risks, especially amidst the prevailing sluggish macroeconomic conditions. Despite the challenges, the Company remains steadfast in its commitment to generating sustainable long-term value for its shareholders and stakeholders. This commitment is exemplified by the decision to declare a dividend payout of USD 0.066 per ADS for the latter half of 2023, constituting approximately 20% of total net income, in line with the Company's capital return program. Notably, for the entire fiscal year of 2023, the Company distributed a cash dividend of USD 0.182 per ADS. Looking ahead to 2024, the Company envisages maintaining or potentially augmenting dividend payouts in response to evolving market conditions.
The Company's resolution to declare a semi-annual dividend underscores its dedication to enhancing shareholder value amidst a challenging economic environment. By earmarking a portion of its earnings for dividend disbursement, the Company aims to incentivize investors while ensuring a delicate equilibrium between sustaining growth and mitigating risks. This strategic approach epitomizes prudent financial management, aimed at bolstering shareholder confidence and fostering enduring sustainability. Moreover, the Company's adaptability in adjusting dividend distributions in line with prevailing market dynamics signifies its responsiveness and commitment to optimizing shareholder returns over the long haul.
1.5 Key Metrics
In the fiscal years spanning from 2019 to 2023, the Company's revenue exhibited fluctuating trends, starting at USD 10,604 million in 2019 and peaking at USD 13,057 million in 2023. Similarly, gross profit figures varied, ranging from USD 4,994 million in 2019 to USD 4,513 million in 2023, with intermittent peaks and troughs observed over the five-year period.
In the fiscal years 2022 and 2023, there were notable shifts in key financial metrics for the company. The gross margin, representing the proportion of revenue retained after accounting for the cost of goods sold, increased from 30.8% in FY22 to 34.6% in FY23. This suggests improved efficiency in production or pricing strategies. Similarly, the EBITDA margin, reflecting earnings before interest, taxes, depreciation, and amortization as a percentage of revenue, surged from 4.7% to 16.2%, indicating enhanced profitability and operational effectiveness. The operating margin, delineating operating income as a percentage of revenue, also exhibited a substantial ascent from 3.4% to 14.4%, underscoring the company's bolstered operational efficiency and cost management. Despite a marginal decrease in the pretax margin from 10.4% to 10.2%, implying a slight reduction in profitability before accounting for taxes, the company maintained its competitive position. Moreover, the net margin, representing net income as a percentage of revenue, experienced a negligible decline from 8.4% to 8.2%, indicating stable profitability despite operational improvements. These shifts in financial metrics indicate a noteworthy transformation in the company's financial performance, characterized by improved efficiency, enhanced profitability, and sustained competitive viability.

Section 2: Business Updates and Financial Highlights
2.1 Recent Updates:
The below picture gives an overview of the recent updates:

2.2 Insights of FY23:

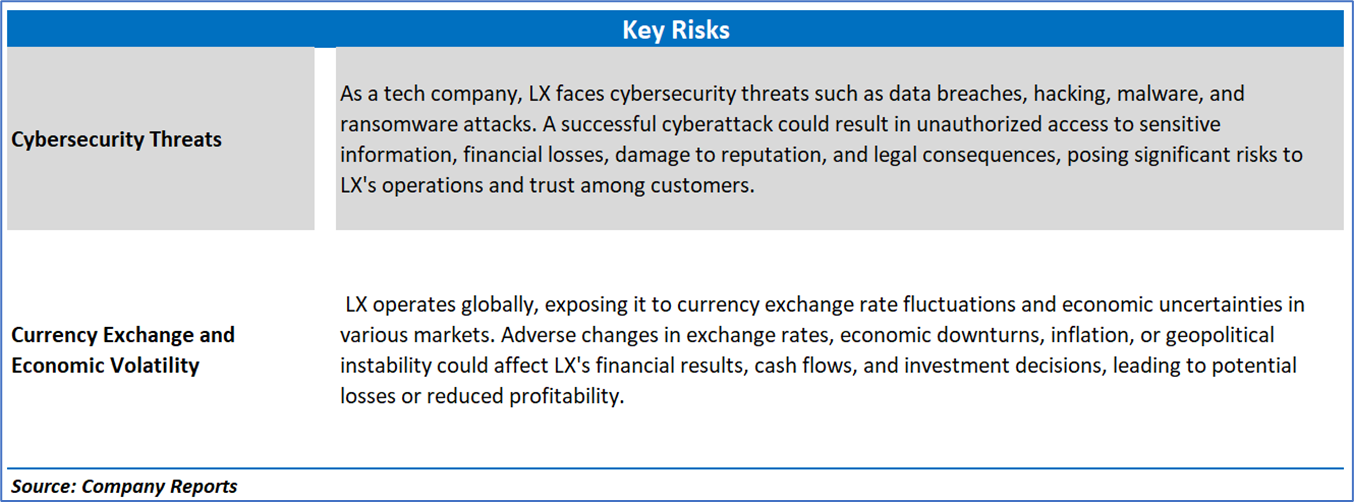
Section 3: Key Risks and Outlook:

Section 4: Stock Recommendation Summary:
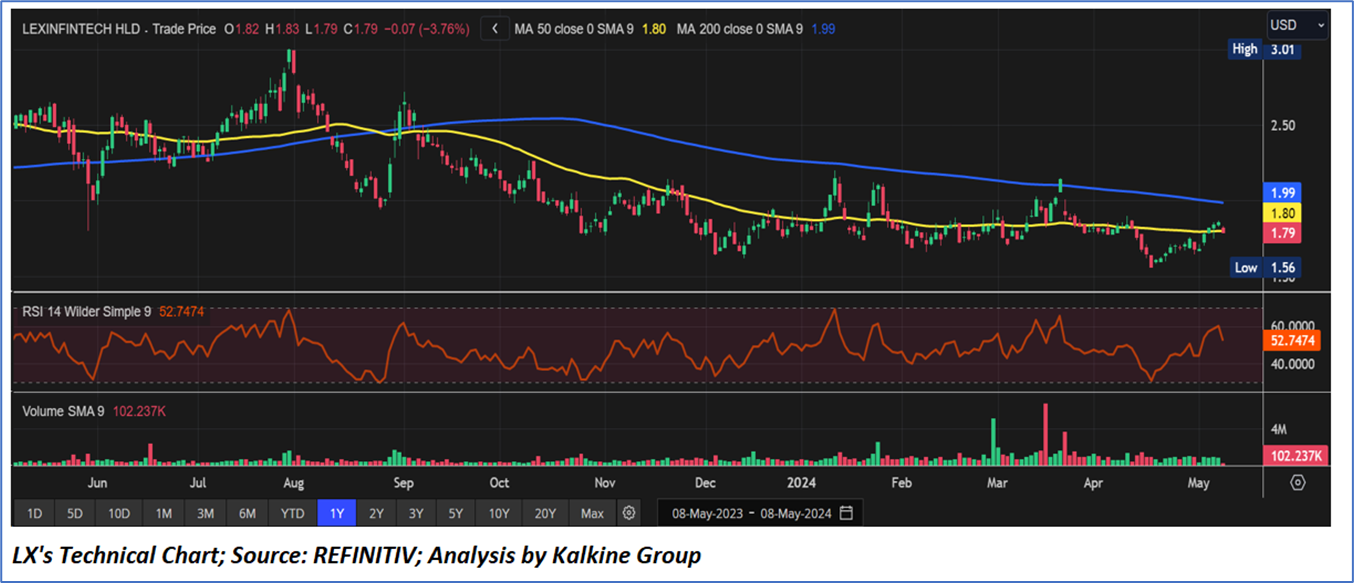
4.1 Technical Summary:

4.2 Fundamental Valuation
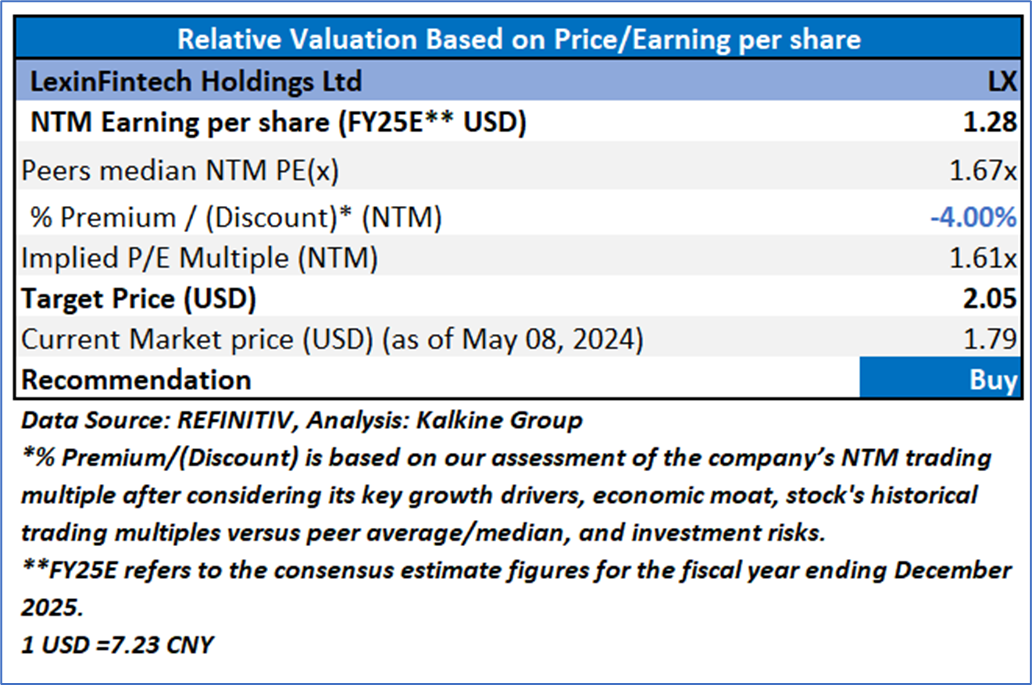
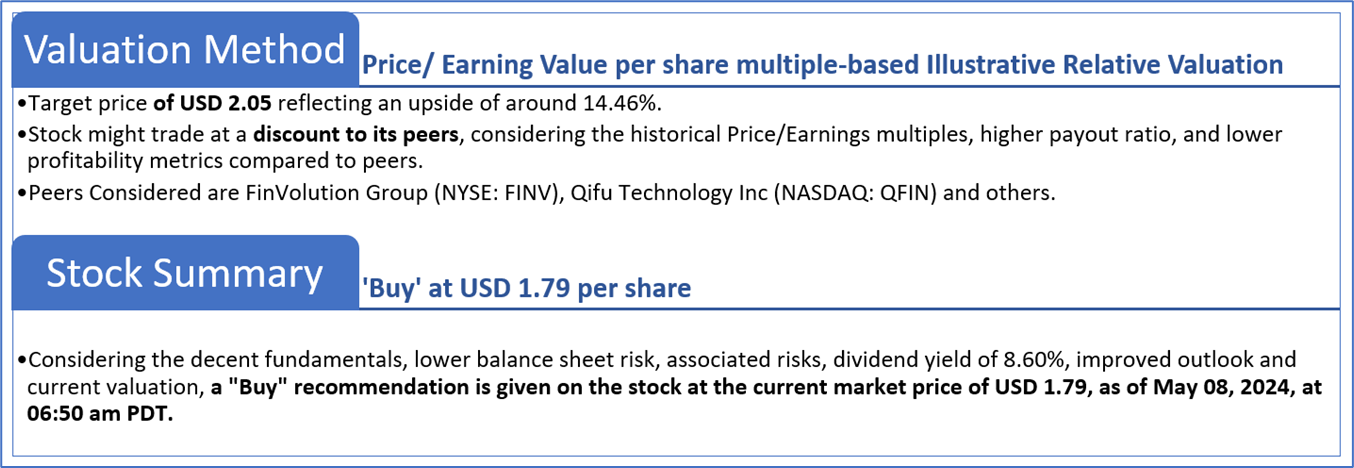
Valuation Methodology: Price/Earnings Per Share Multiple Based Relative Valuation
Markets are trading in a highly volatile zone currently due to certain macroeconomic issues and geopolitical tensions prevailing. Therefore, it is prudent to follow a cautious approach while investing.
Note 1: Past performance is not a reliable indicator of future performance.
Note 2: The reference date for all price data, currency, technical indicators, support, and resistance levels is May 08, 2024. The reference data in this report has been partly sourced from REFINITIV.
Note 3: Investment decisions should be made depending on an individual's appetite for upside potential, risks, holding duration, and any previous holdings. An 'Exit' from the stock can be considered if the Target Price mentioned as per the Valuation and or the technical levels provided has been achieved and is subject to the factors discussed above.
Note 4: The report publishing date is as per the Pacific Time Zone.
Technical Indicators Defined: -
Support: A level at which the stock prices tend to find support if they are falling, and a downtrend may take a pause backed by demand or buying interest. Support 1 refers to the nearby support level for the stock and if the price breaches the level, then Support 2 may act as the crucial support level for the stock.
Resistance: A level at which the stock prices tend to find resistance when they are rising, and an uptrend may take a pause due to profit booking or selling interest. Resistance 1 refers to the nearby resistance level for the stock and if the price surpasses the level, then Resistance 2 may act as the crucial resistance level for the stock.
Stop-loss: It is a level to protect against further losses in case of unfavorable movement in the stock prices.
The advice given by Kalkine Canada Advisory Services Inc. and provided on this website is general information only and it does not take into account your investment objectives, financial situation and the particular needs of any particular person. You should therefore consider whether the advice is appropriate to your investment objectives, financial situation and needs before acting upon it. You should seek advice from a financial adviser, stockbroker or other professional (including taxation and legal advice) as necessary before acting on any advice. Not all investments are appropriate for all people. The website www.kalkine.ca is published by Kalkine Canada Advisory Services Inc. The link to our Terms & Conditions has been provided please go through them. On the date of publishing this report (mentioned on the website), employees and/or associates of Kalkine do not hold positions in any of the stocks covered on the website. These stocks can change any time and readers of the reports should not consider these stocks as advice or recommendations later.