
This report is an updated version of the report published on 22 November 2024 at 03:48 PM AEDT.
Section 1: Company Overview, Low Carbon Emission Initiatives and Fundamentals
Section 1.1: Medibank Private Limited (ASX: MPL) is an integrated healthcare company that provides private health insurance and health solutions in Australia. MPL also offers other insurance, including travel, pet, and life insurance, to make things easier for its customers. Kalkine’s Low Carbon Research Report covers the Investment Highlights, Low Carbon Emission Initiatives, Key Financial Metrics, Risks, and Technical Analysis along with the Valuation, Target Price, and Recommendation on the stock.
Section 1.2: Why Low Carbon Emission Matters?
The shift toward a low-carbon economy is one of the most significant challenges of current time, spurred by the urgent need to combat climate change and reduce the environmental impact of corporate activities. This report covers the ASX-listed low-carbon emission company, Medibank Private Ltd (ASX: MPL), that is committed to sustainability and responsible environmental practices.
Carbon and Waste Management - Key Metrics
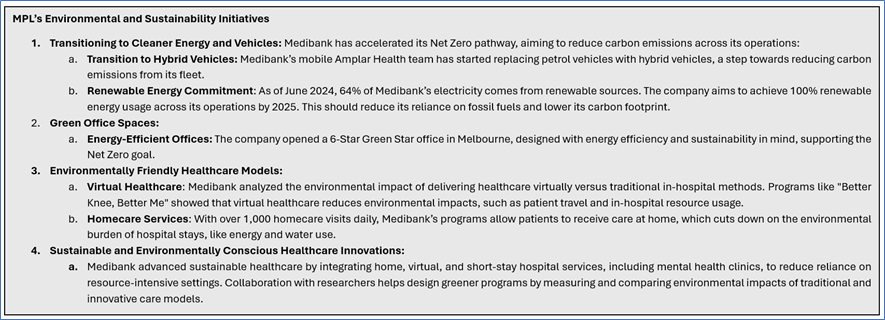
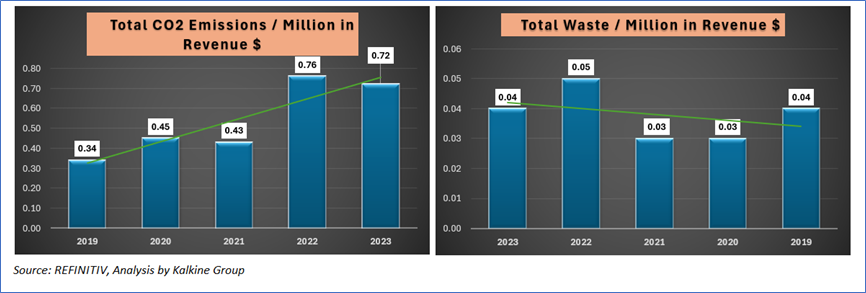
Medibank is reducing carbon emissions by transitioning to hybrid vehicles, sourcing 64% renewable energy (targeting 100% by 2025), and adopting energy-efficient infrastructure. MPL’s sustained environmental efforts have been reducing waste management metrics since 2019.
Peer Comparison: Carbon Emission and Waste Management Metrics
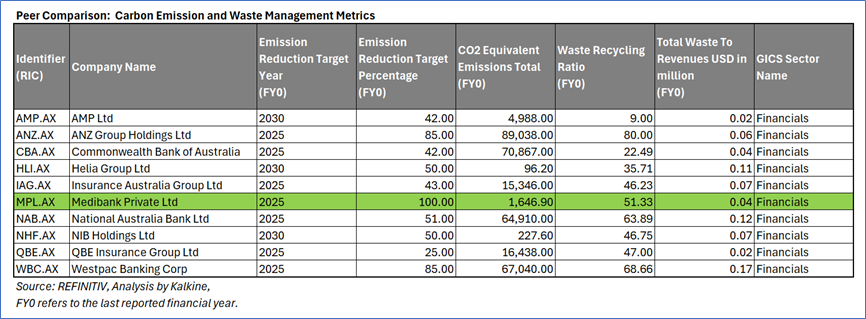
Medibank has set a 100% emission reduction target by 2025, which is an ambitious target among the listed companies. The company reports a relatively low CO2 equivalent emissions total of 1,646.90 metric tons, significantly lower than peers. MPL has a high waste recycling ratio of 51.33, reflecting positive efforts in managing waste sustainably.
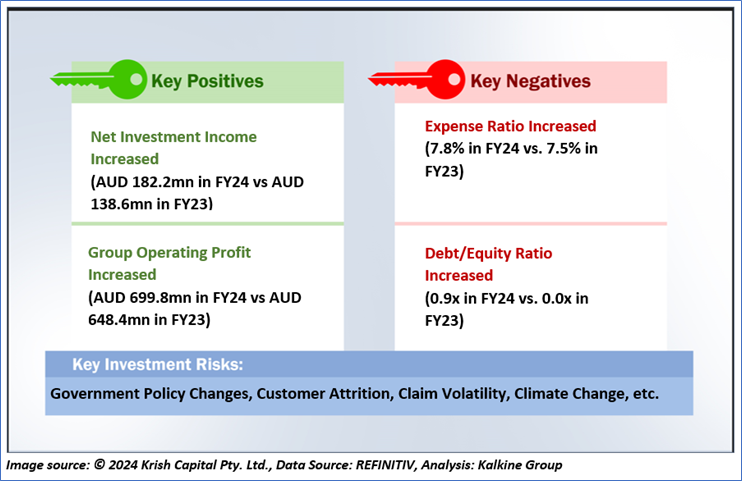
1.3 The Key Positives, Negatives, Investment Highlights, and Risks
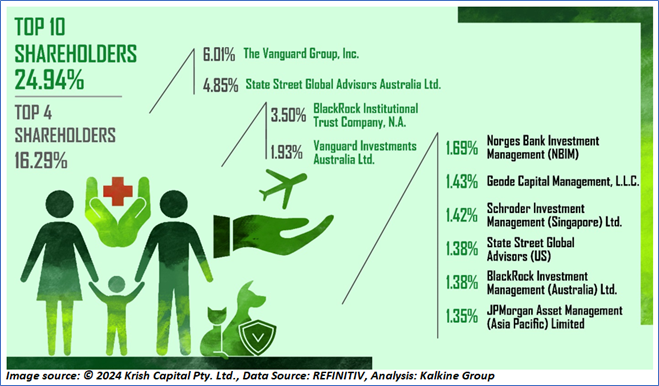
1.4 Top 10 Shareholders:
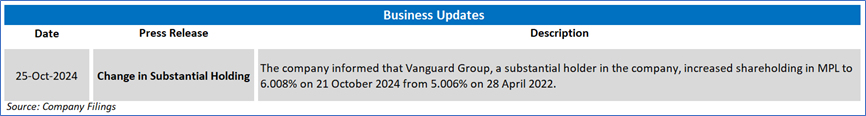
The top 10 shareholders together form ~24.94% of the total shareholding. The Vanguard Group, Inc. and State Street Global Advisors Australia Ltd., hold maximum stakes in the company at ~6.01% and ~4.85%, respectively.
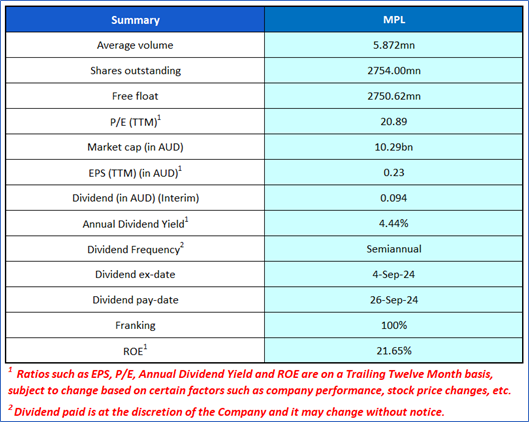
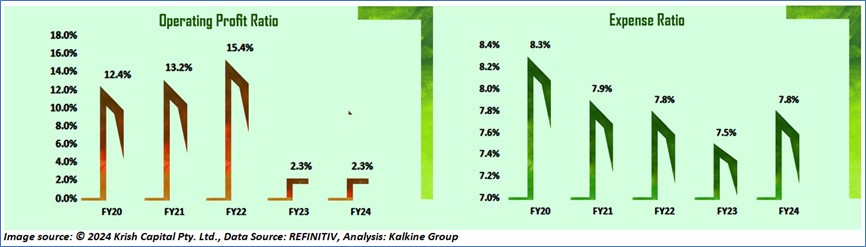
1.5 Key Metrics: MPL's net investment income increased to AUD 182.2mn in FY24 vs AUD 138.6mn in FY23. Below are captured other metrics:
Section 2: Business Updates, Financial and Operational Highlights
2.1 Recent Business Updates:
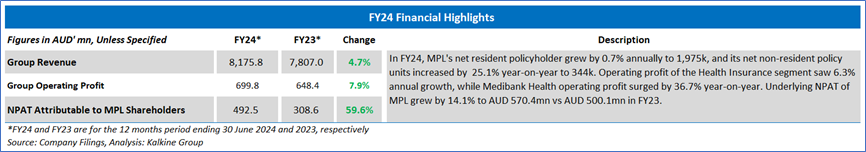
2.2 FY24 Results Highlights
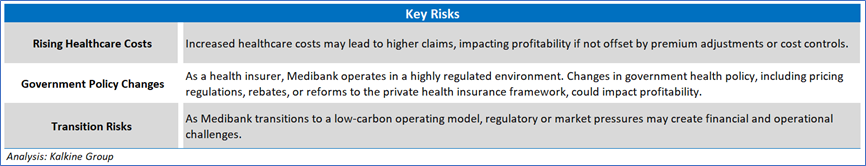
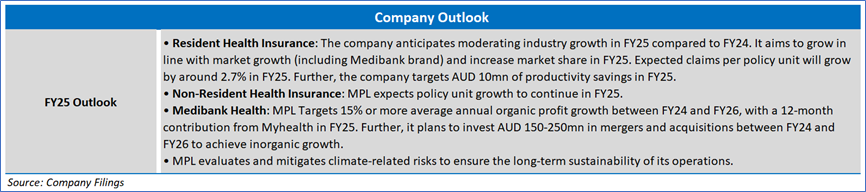
Section 3: Key Risks and Outlook:
Section 4: Stock Recommendation Summary
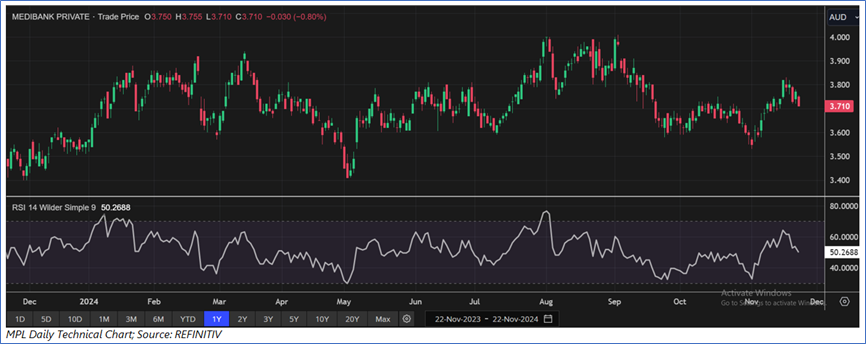
4.1 Price Performance and Technical Summary
The stock price has declined by ~6.09% in the last three month, whereas over the last six months, it has increased by ~2.01%. The stock has a 52-week low and 52-week high of AUD 3.400 and AUD 4.010, respectively, and is currently trading above the mid points of its 52-week low and 52-week high. MPL was last covered in a report dated ‘20 July 2022’.
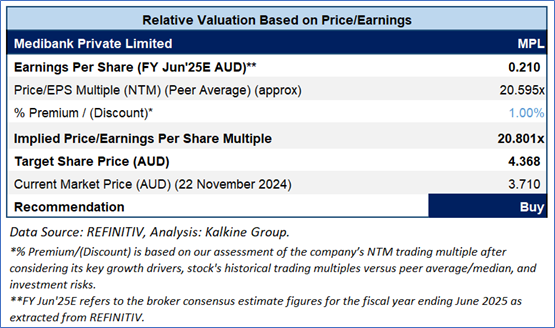
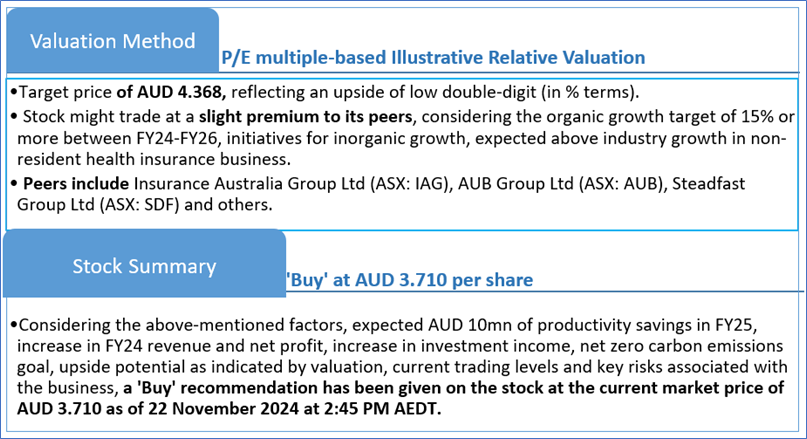
4.2 Fundamental Valuation
Valuation Methodology: P/E Multiple Based Relative Valuation (Illustrative)
Markets are trading in a highly volatile zone currently due to certain macro-economic issues and geopolitical tensions prevailing. Therefore, it is prudent to follow a cautious approach while investing.
Note 1: Past performance is neither an indicator nor a guarantee of future performance.
Note 2: The reference date for all price data, currency, technical indicators, support, and resistance levels is 22 November 2024. The reference data in this report has been partly sourced from REFINITIV.
Note 3: Investment decisions should be made depending on an individual's appetite for upside potential, risks, holding duration, and any previous holdings. An 'Exit' from the stock can be considered if the Target Price mentioned as per the Valuation and or the technical levels provided has been achieved and is subject to the factors discussed above.
Note 4: Dividend Yield may vary as per the stock price movement.
Technical Indicators Defined: -
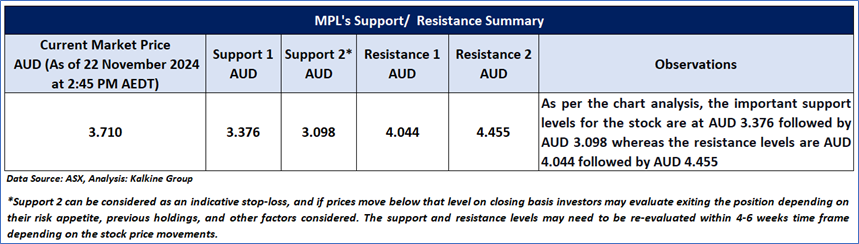
Support: A level at which the stock prices tend to find support if they are falling, and a downtrend may take a pause backed by demand or buying interest. Support 1 refers to the nearby support level for the stock and if the price breaches the level, then Support 2 may act as the crucial support level for the stock.
Resistance: A level at which the stock prices tend to find resistance when they are rising, and an uptrend may take a pause due to profit booking or selling interest. Resistance 1 refers to the nearby resistance level for the stock and if the price surpasses the level, then Resistance 2 may act as the crucial resistance level for the stock.
Stop-loss: It is a level to protect further losses in case of unfavourable movement in the stock prices.
The advice given by Kalkine Canada Advisory Services Inc. and provided on this website is general information only and it does not take into account your investment objectives, financial situation and the particular needs of any particular person. You should therefore consider whether the advice is appropriate to your investment objectives, financial situation and needs before acting upon it. You should seek advice from a financial adviser, stockbroker or other professional (including taxation and legal advice) as necessary before acting on any advice. Not all investments are appropriate for all people. The website www.kalkine.ca is published by Kalkine Canada Advisory Services Inc. The link to our Terms & Conditions has been provided please go through them. On the date of publishing this report (mentioned on the website), employees and/or associates of Kalkine do not hold positions in any of the stocks covered on the website. These stocks can change any time and readers of the reports should not consider these stocks as advice or recommendations later.
 Please wait processing your request...