Company Overview: Paramount Global (NASDAQ: PARAA) is a media, streaming and entertainment company. The Company has three segments. TV Media segment consists of its broadcast operations.
US Markets Round-Up
The Russell 3000 index, a widely followed benchmark of the US stock market across various market capitalizations, started the week on a strong footing, but subsequently lost momentum and declined. The index made high of 3208.651 during the week and settled at 3169.457 with a week-to-date (WTD) gain of ~0.322 percent on Aug 22, 2024. Other major indices, such as S&P 500 and NASDAQ Composite displayed sideways move for the week. On Aug 22, 2024, the S&P 500 index settled at 5570.65 with a WTD gain of ~0.30% percent, while the NASDAQ Composite Index settled at 17619.35 with a WTD loss of ~ 0.07 percent.
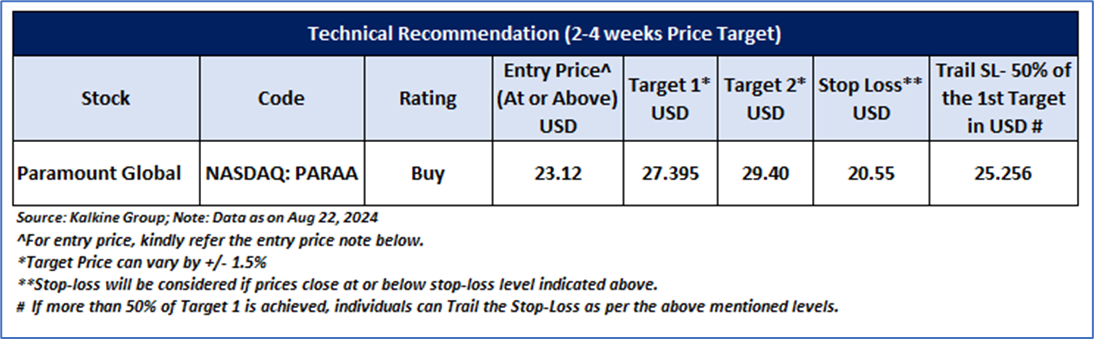
Having understood the US market performance over the week, taking cues from major global news, and based on technical analysis of the Russell 3000 index for the upcoming week, now let’s have a look at the one US-listed stock to pick from the technical standpoint. Noted below recommendation is based on the entry price, target prices, and stop-loss for Paramount Global (NASDAQ: PARAA) for the next 2-4 weeks duration:
Paramount Global (NASDAQ: PARAA)
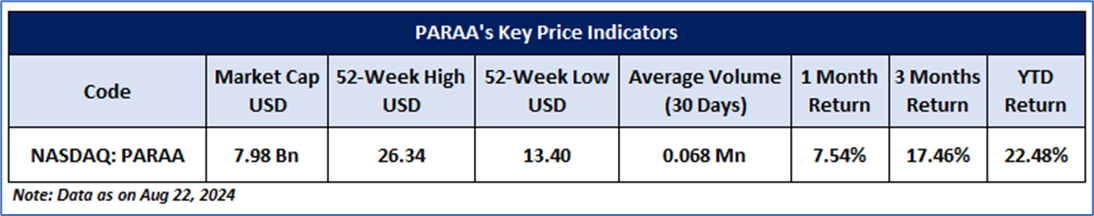
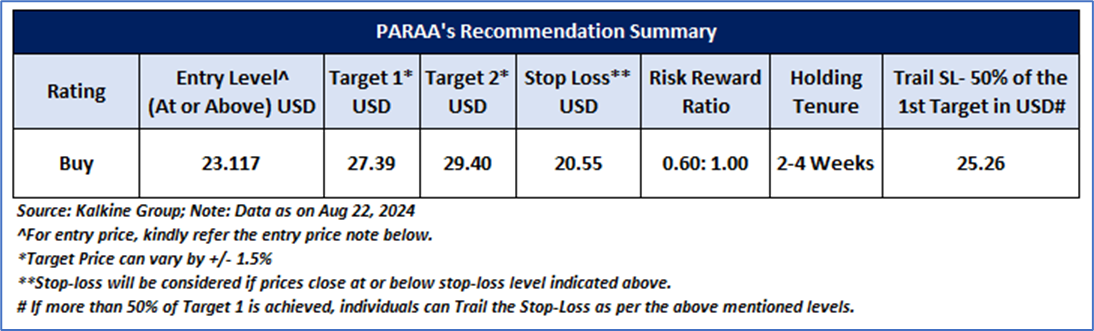
Noted below are the key price indicators for the stock:
Price Action Analysis (on the daily chart)
PARAA's stock price has demonstrated remarkable resilience by finding support at critical levels and steadily rising in value and has now broken above key trendline resistance. This development suggests a potential near-term uptrend. However, the stock is now poised to face a significant test in the coming weeks, with the crucial level of USD 27.39 serving as hurdle. If PARAA successfully clears this threshold, it may trigger a surge of buying activity, potentially driving the stock's value even higher and potentially fueling a further upward trajectory.
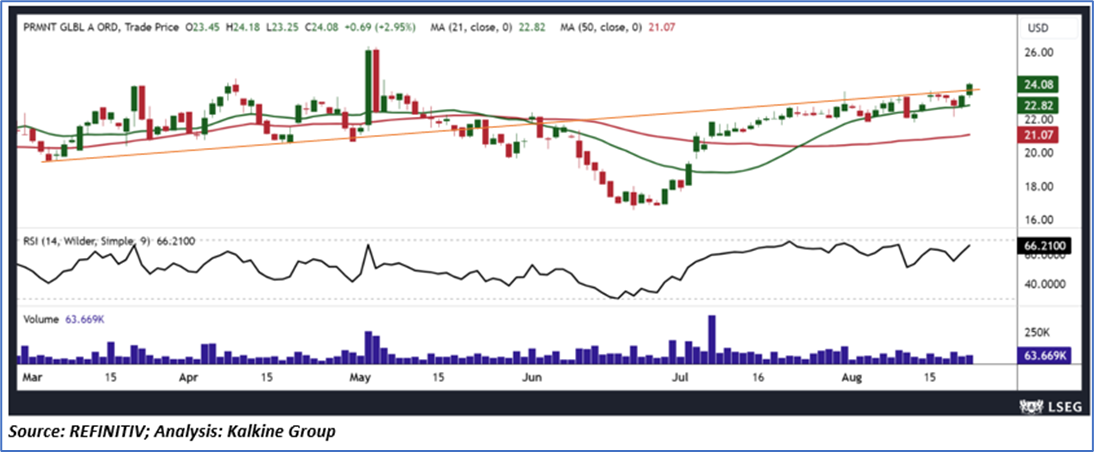

Technical Indicators Analysis (On the daily chart)
The daily chart reveals a notable reversal in the Relative Strength Index (RSI), signalling a significant shift in momentum towards a positive and upward trajectory. This momentum is expected to continue, driving the trend forward in a bullish direction. Furthermore, the stock's current position above its 21-day and 50-day Simple Moving Averages (SMAs) provides a solid foundation for support, which could help mitigate any short-term price fluctuations and serve as a buffer against potential dips.
General Recommendation
As per the above-mentioned price action and technical indicators analysis, Paramount Global (NASDAQ: PARAA) is looking technically well-placed on the chart, and a ‘Buy’ recommendation has been given on the stock. Investment decision should be made depending on an individual’s appetite for upside potential, risks, and any previous holdings. This recommendation is purely based on technical analysis, and fundamental analysis has not been considered in this report. The summary of recommendation is as follows:
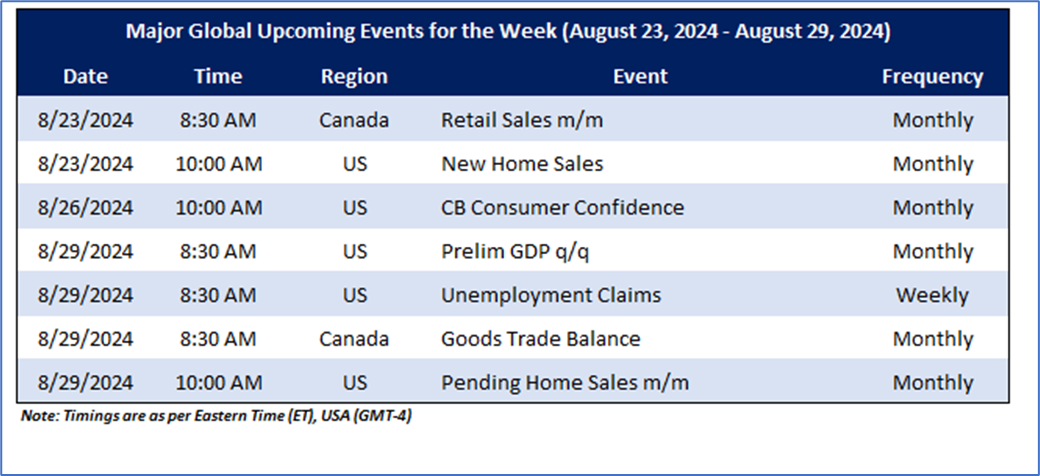
Upcoming Major Global Economic Events
Market events occur daily depending on the data's frequency and generally include updates on GDP, Retail Sales, Unemployment Data, etc. The upcoming week's major global economic events that could impact the S&P/TSX Venture Composite Index and listed stocks' prices are noted below.
Related Risks: This report may be looked at from a high-risk perspective and recommendations are provided for a short duration. Recommendations provided in this report are solely based on technical parameters, and the fundamental performance of the stocks has not been considered in the decision-making process. Other factors which could impact the stock prices include market risks, regulatory risks, interest rates risks, currency risks, social and political instability risks etc.
Note 1: Individuals can consider exiting from the stock if the Target Price or Stop loss mentioned as per the technical analysis has been achieved and subject to the factors discussed above.
Note 2: How to Read the Charts?
The Green colour line reflects the 21-period moving average while the red line indicates the 50- period moving average. SMA helps to identify existing price trend. If the prices are trading above the 21-period and 50-period moving average, then it shows prices are currently trading in a bullish trend.
The Black colour line in the chart’s lower segment reflects the Relative Strength Index (14-Period) which indicates price momentum and signals momentum in trend. A reading of 70 or above suggests overbought status while a reading of 30 or below suggests an oversold status.
The Blue colour bars in the chart’s lower segment show the volume of the stock. The volume is the number of shares that changed hands during a given day. Stocks with high volumes are more liquid than stocks with lesser volume as liquidity in stocks helps in easier and faster execution of the order.
The Orange colour lines are the trend lines drawn by connecting two or more price points and used for trend identification purposes. The trend line also acts as a line of support and resistance.
Technical Indicators Defined: -
Support: A level at which the stock prices tend to find support if they are falling, and a downtrend may take a pause backed by demand or buying interest. Support 1 refers to the nearby support level for the stock and if the price breaches the level, then Support 2 may act as the crucial support level for the stock.
Resistance: A level at which the stock prices tend to find resistance when they are rising, and an uptrend may take a pause due to profit booking or selling interest. Resistance 1 refers to the nearby resistance level for the stock and if the price surpasses the level, then Resistance 2 may act as the crucial resistance level for the stock.
Stop-loss: It is a level to protect further losses in case of unfavourable movement in the stock prices.
Risk Reward Ratio: Risk reward ratio is the difference between an entry point to a stop loss and profit level. This report is based on ~60% Stop Loss of the Target 1 from the entry point.
A trailing stop-loss is a modification of stop-loss in case of favourable movement in the price to protect the gains. Individuals can Trail the Stop-Loss as per the aforementioned levels if the stock price achieves more than 50% of the Target 1. Individuals should consider exiting from the position as per the Trailing Stop-Loss level if the price starts moving downwards after achieving more than 50% of the Target 1.
The reference date for all price data, currency, technical indicators, support, and resistance levels is Aug 22, 2024. The reference data in this report has been partly sourced from REFINITIV.
Abbreviations
CMP: Current Market Price
SMA: Simple Moving Average
RSI: Relative Strength Index
USD: United States dollar
Note: Trading decisions require a thorough analysis by individuals. Technical reports in general chart out metrics that may be assessed by individuals before any stock evaluation. The above are illustrative analytical factors used for evaluating the stocks; other parameters can be looked at along with additional risks per se. Past performance is neither an indicator nor a guarantee of future performance.
The advice given by Kalkine Canada Advisory Services Inc. and provided on this website is general information only and it does not take into account your investment objectives, financial situation and the particular needs of any particular person. You should therefore consider whether the advice is appropriate to your investment objectives, financial situation and needs before acting upon it. You should seek advice from a financial adviser, stockbroker or other professional (including taxation and legal advice) as necessary before acting on any advice. Not all investments are appropriate for all people. The website www.kalkine.ca is published by Kalkine Canada Advisory Services Inc. The link to our Terms & Conditions has been provided please go through them. On the date of publishing this report (mentioned on the website), employees and/or associates of Kalkine do not hold positions in any of the stocks covered on the website. These stocks can change any time and readers of the reports should not consider these stocks as advice or recommendations later.
 Please wait processing your request...