Section 1: Company Overview and Fundamentals Insights
Company Overview: Paladin Energy Ltd (ASX: PDN) is an Australia-based independent uranium producer with a 75% ownership of the world-class long life Langer Heinrich Mine (LHM) located in Namibia. It also owns a portfolio of uranium exploration and development assets in Canada and Australia. Kalkine’s Global Green Energy Report covers the Investment Highlights, Management Insights, Key Financial Metrics, Risks, and Technical Analysis along with the Valuation, Target Price, and Recommendation on the stock.
1.2 The Key Positives, Negatives, Investment Highlights, and Risks


1.3 Top 10 Shareholders:
The top 10 shareholders together form ~45.48% of the total shareholding. Mirae Asset Global Investments (USA) LLC and Fidelity Management & Research Company LLC, hold maximum stakes in the company at ~7.19% and ~5.50%, respectively.

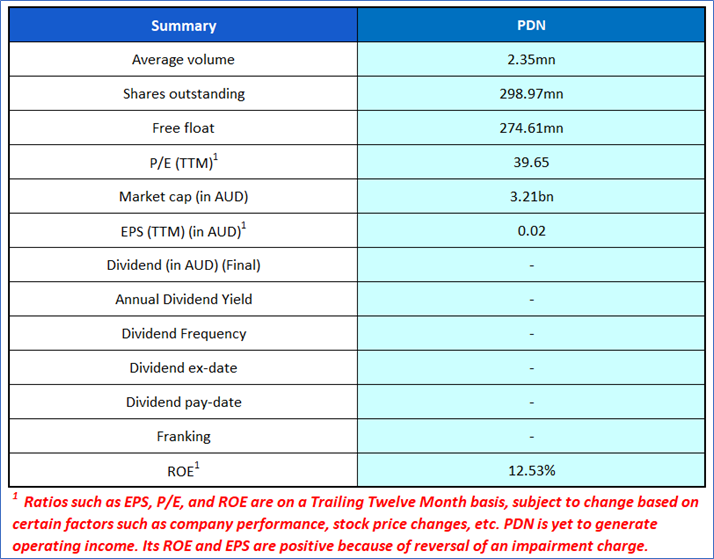
1.4 Key Metrics: PDN's return on equity turned positive in H1FY24 at 13.9% vs -1.2% in H1FY23. Below are captured other metrics:

Section 2: Business Updates, Financial and Operational Highlights
2.1 Recent Business Updates:

2.2 H1FY24 Results Highlights (for the period ended 31 December 2023): Below mentioned are some key financial highlights:

2.3 Historical Financial Trend

Section 3: Key Risks and Outlook:


Section 4: Stock Recommendation Summary
4.1 Price Performance and Technical Summary
The stock has declined by ~35.68% in the last three months, whereas over the last six month, it has corrected by ~19.28%. The stock has a 52-week low and 52-week high of AUD 8.100 and AUD 17.980, respectively, and is currently trading below the average of 52-week high and low. PDN was last covered in a report dated ‘1 August 2024’.


4.2 Fundamental Valuation
Valuation Methodology: Price/Sales Multiple Based Relative Valuation (Illustrative)

Markets are trading in a highly volatile zone currently due to certain macro-economic issues and geopolitical tensions prevailing. Therefore, it is prudent to follow a cautious approach while investing.
Note 1: Past performance is neither an indicator nor a guarantee of future performance.
Note 2: The reference date for all price data, currency, technical indicators, support, and resistance levels is 28 August 2024. The reference data in this report has been partly sourced from REFINITIV.
Note 3: Investment decisions should be made depending on an individual's appetite for upside potential, risks, holding duration, and any previous holdings. An 'Exit' from the stock can be considered if the Target Price mentioned as per the Valuation and or the technical levels provided has been achieved and is subject to the factors discussed above.
Note 4: Dividend Yield may vary as per the stock price movement.
Technical Indicators Defined: -
Support: A level at which the stock prices tend to find support if they are falling, and a downtrend may take a pause backed by demand or buying interest. Support 1 refers to the nearby support level for the stock and if the price breaches the level, then Support 2 may act as the crucial support level for the stock.
Resistance: A level at which the stock prices tend to find resistance when they are rising, and an uptrend may take a pause due to profit booking or selling interest. Resistance 1 refers to the nearby resistance level for the stock and if the price surpasses the level, then Resistance 2 may act as the crucial resistance level for the stock.
Stop-loss: It is a level to protect further losses in case of unfavourable movement in the stock prices.
The advice given by Kalkine Canada Advisory Services Inc. and provided on this website is general information only and it does not take into account your investment objectives, financial situation and the particular needs of any particular person. You should therefore consider whether the advice is appropriate to your investment objectives, financial situation and needs before acting upon it. You should seek advice from a financial adviser, stockbroker or other professional (including taxation and legal advice) as necessary before acting on any advice. Not all investments are appropriate for all people. The website www.kalkine.ca is published by Kalkine Canada Advisory Services Inc. The link to our Terms & Conditions has been provided please go through them. On the date of publishing this report (mentioned on the website), employees and/or associates of Kalkine do not hold positions in any of the stocks covered on the website. These stocks can change any time and readers of the reports should not consider these stocks as advice or recommendations later.
 Please wait processing your request...