
Company Overview: The Goodyear Tire & Rubber Company is a manufacturer of tires. The Company operates through three segments. The Americas segment develops, manufactures, distributes and sells tires and related products and services in North, Central and South America, and sells tires to various export markets. The Americas segment manufactures and sells tires for automobiles, trucks, buses, earthmoving, mining and industrial equipment, aircraft and for various other applications. The Europe, the Middle East and Africa (EMEA) segment develops, manufactures, distributes and sells tires for automobiles, trucks, buses, aircraft, motorcycles, and earthmoving, mining and industrial equipment throughout EMEA under the Goodyear, Dunlop, Debica, Sava and Fulda brands. The Asia Pacific segment develops, manufactures, distributes and sells tires for automobiles, trucks, aircraft, farm, and earthmoving, mining and industrial equipment throughout the Asia Pacific region, and sells tires to various export markets.
.png)
GT Details
Focus on Operational Efficiency and Product Innovation: The Goodyear Tire & Rubber Company (NASDAQ: GT) is one of the world’s leading manufacturers of tires, possessing recognized brand names and operating across the major regions globally. The company has a wide global footprint that includes 47 manufacturing facilities across 21 countries. As per the global operations of the business, GT operates through three major segments – (i) Americas; (ii) Europe, Middle East and Africa; and (iii) Asia Pacific. The company has two Innovation Centers located at Akron, Ohio, and Colmar-Berg, Luxembourg, which strive to develop state-of-the-art products and services. Looking at the financial performance, for FY18, total net revenue posted a growth of 0.6% to $15,475 million, driven by improvements in price and mix and a two percent increase in replacement tire volume. Net profit for FY18 came in at $693 million, compared to $346 million in FY17, driven by the net gain recognized in relation to the TireHub transaction, a decrease in income tax expense and lower rationalization charges. Looking at the past performance, GT delivered a CAGR of ~31.2% in net profit over the period of FY15 to FY18.
In March 2019, GT commenced the modernization of its two manufacturing facilities, located in Germany with the intention to the furtherance of the strategy to strengthen the competitiveness of the company’s manufacturing footprint and increase the production of premium, large-rim diameter consumer tires. In September 2019, GT approved its strategy to offer voluntary buy-outs to certain associates at the tire manufacturing facility in Gadsden, Alabama, in furtherance of the company’s strategy to strengthen the competitiveness of the manufacturing footprint by curtailing production of tires for declining, less profitable segments of the tire market.
Going forward, the company is likely to enhance its manufacturing efficiency and intend to create an advantaged supply chain focused by reducing the total delivered expenses, improving working capital levels and delivering better customer services. .png)
FY16- FY18 Income Statement Highlights (Source: Company Reports)
Q3FY19 Operational Highlights for the Period Ended 30 September 2019: The company recently came up with its quarterly results and the period was marked by strong volume growth in China, aided by double-digit growth in the consumer original equipment and replacement segment followed by a decent performance from US replacement segment. The Global commercial truck tire shipments delivered better than industry growth during Q3FY19. The business experienced better pricing of raw materials followed by robust volume growth from Brazil.
In 3QFY19, the company reported net sales at $3,802 million, down 3.2% on y-o-y basis on account of lower tire unit sales of 3,233 million units as compared to 3,314 million units in Q3FY18. Worldwide tire unit sales during Q3FY19 came in at 40.3 million, declined 0.7% on y-o-y basis. The business reported a decline in OE volume by 5.2% on y-o-y basis, primarily due to lower vehicle production globally. Replacement tire volume increased by 0.8% on y-o-y basis, aided by growth across Americas and Asia Pacific, partially offset by decreased volume in EMEA. The business reported a lower gross margin at 22% as compared to 22.9% in Q3FY18 followed by segment operating margin at 7.7% as compared to 9.2% in the previous corresponding quarter. Cost of goods sold came in at $2,965 million, down 2.1% on y-o-y basis due to foreign currency translation of $48 million, primarily in EMEA and the Asia Pacific, lower costs in other tire-related businesses of $36 million. Interest expense during Q3FY19 came in at $88 million, compared to $82 million in the previous corresponding quarter..png)
Q2FY19 Income Statement Highlights (Source: Company Reports)
Segment Highlights for the Third Quarter of FY19: During Q3FY19, the Americas segment reported sales of $2,049 million as compared to $2,107 million in the previous corresponding period. Replacement tire volume witnessed a growth of 0.4 million units, or 3.2% on y-o-y basis, primarily in the consumer business aided by the growth in 17-inch and above rim size tires across the US and with the inclusion of new customers in Brazil. OE tire volume reported a decline of 0.3 million units, or 6.8% on y-o-y basis due to lower vehicle production across the consumer business in the United States, followed by the impact resulting from a strike at a major OE customer, and the OE selectivity strategy.
The business derived $1,205 million of sales from Europe, Middle East and Africa region (EMEA) as compared to $1,290 million in Q3FY18 due to lower consumer replacement volumes, reflecting decreased industry demand and challenges across the distribution channels. The OE tire segment across EMEA reported a volume decline of 0.2 million units, primarily driven by lower vehicle production, followed by exit of declining, less profitable market segments.
Asia Pacific Segment reported total sales of $548 million, increased from $531 million units in the previous corresponding quarter, driven by higher tire unit volume at $25 million and improvements in price and product mix of $6 million. The positives were partially offset by unfavorable foreign currency translation of $10 million on account of the weakening Chinese yuan and Australian dollar and a decline in sales across other tire-related businesses of $4 million. Unit sales from the Asia Pacific during Q3FY19 came in at 7.9 million units, depicting a growth of 5.4% on y-o-y basis. Volume from the OE tire segment increased by 2% on y-o-y basis, primarily driven by consumer business in China, partially offset by softness in India. Replacement tire volume 7.4% on y-o-y basis, primarily due to the consumer business in Japan and China..png)
Q3FY19 Segment-wise Performance (Source: Company Reports)
.png)
Q3FY18 Segment-wise Performance (Source: Company Reports)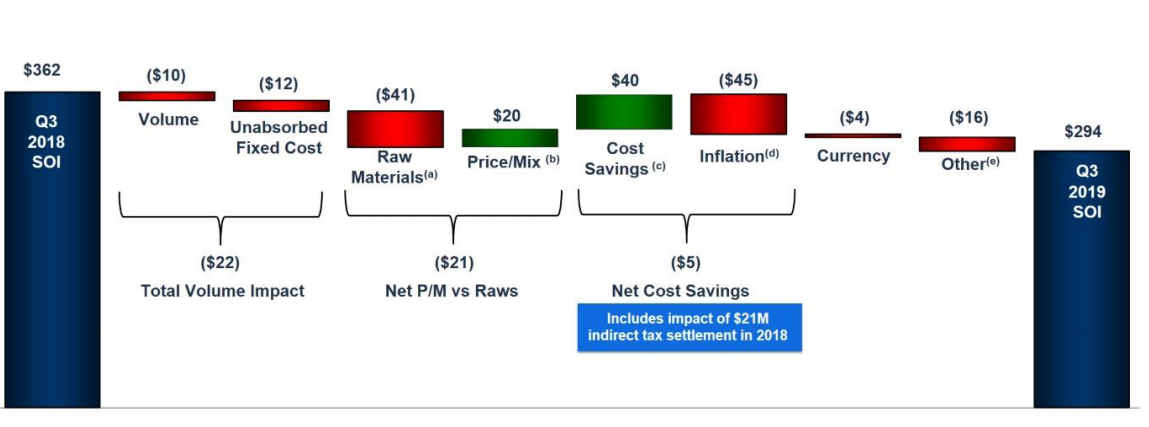
Segment’s Operating Results (Source: Company Reports)
9MFY19 Operational Highlights: The company reported net sales at $11,032 million as compared to the $11,599 million in the previous corresponding period on account of unfavorable foreign currency translation, primarily in EMEA and Americas regions, lower tire unit volumes across EMEA and the Asia Pacific, and a decline in sales in other tire-related businesses. The business witnessed declining sales across tire-related segment due to a decrease in third-party sales of chemical products in the Americas, which was partially offset by an improvement in price and product mix, primarily in EMEA and Americas regions.
The company reported an operating income of $703 million as compared to $967 million in 9MFY18. The decrease of $264 million in the operating income was primarily attributed to the higher raw material costs of $187 million and lower tire unit volumes of $62 million, primarily across the EMEA and the Asia Pacific regions. The lower income from other tire-related businesses of $38 million represents lower third-party chemical sales in Americas, followed by the impact of unfavorable foreign currency translation of $29 million, offset by favorable indirect tax settlement in Brazil of $21 million. Net income, during the period, came in at $81 million as compared to net income of $583 million in the 9MFY18 on account of a gain, net of transaction costs, of $273 million, recognized during the TireHub transaction during FY18.
Outlook: For the full-year FY19, the business expects benefits from the ramp-up of the new Americas manufacturing facility and TireHub, followed by pricing actions that were implemented during 2018 and during the first half of 2019. GT also expects the continuation of strong performance for the sale of 17-inch and above consumer replacement tires, and continuing net cost savings initiatives in the coming quarters. However, challenging global industry conditions, including higher raw material costs, foreign currency headwinds, lower demand across the global OE segment, weakening demand in Europe, and volatility across the emerging markets are likely to have an unfavorable impact on the business.
Top 10 Shareholders: The top 10 shareholders have been highlighted in the table, which together forms around 48.10% of the total shareholding. BlackRock Institutional Trust Company, N.A. and the Vanguard Group, Inc. hold the maximum interests in the company at 9.44% and 9.35%, respectively.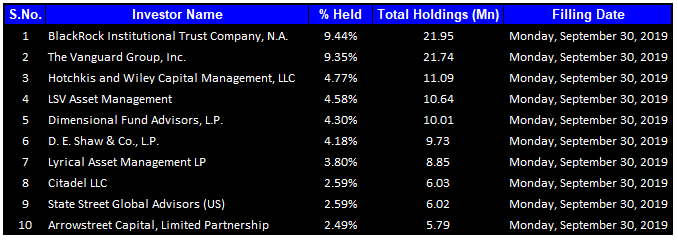
Top 10 Shareholders (Source: Thomson Reuters)
Key Metrics: The company reported mixed numbers in Q2FY20, wherein GT reported gross margin at 22% as compared to 21.4% in Q2FY19. The EBITDA margin, during Q3FY19, came in at 11.2%, higher than 9.3% in Q3FY18. Operating margin during the third quarter of FY19 came in at 5.5%, improved from 4.2% in Q2FY19. The company reported a higher ROE in Q3FY19 at 1.8% as compared to 1.1% in Q2FY19.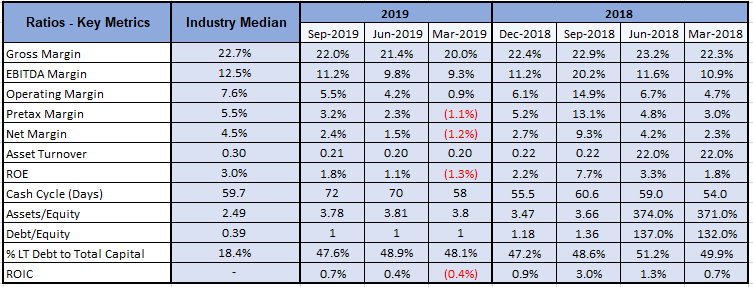
Key Metrics (Source: Thomson Reuters)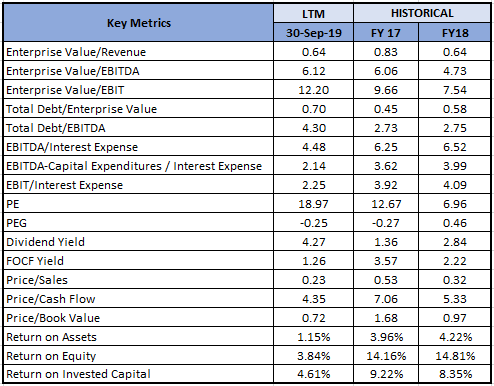
Key Valuation Metrics (Source: Thomson Reuters)
Key Risks: The global scenario for the tire segment is going through tepid times on account of weak light vehicle production in the recent past. The above situation may hinder the tire volumes in the coming quarters. Within the European segment, the business is experiencing soft demand followed by challenges across the distribution. Strong US Dollar might result in lower realizations from other geographies.
Valuation Methodologies: Enterprise Value to EBITDA Multiple Approach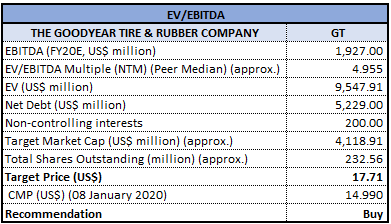
EV/EBITDA Based Valuation (Source: Thomson Reuters)
Note: All forecasted figures and peers have been taken from Thomson Reuters, *NTM-Next Twelve Months
Stock Recommendation: The stock of GT closed at $14.99 with a market capitalization of $3.486 billion. At the current market price, the stock is quoting at the lower band of its 52-week trading range of $10.74 to $22.17. The stock has generated positive returns of ~11.12% and ~1.69% in the last three months and six months, respectively. The stock has corrected ~28.8% in the last one year. The company is focused on building the brand value, increase its market share and becoming consumers’ preferred choice through developing great products and services that anticipate and respond to the needs of consumers. Considering the aforesaid facts, we have valued the stock using one relative valuation method, i.e., Enterprise Value to EBITDA multiple approach. For the matter, we have taken the peer group - Cooper Tire & Rubber Co (NASDAQ: CTB), Continental AG (NASDAQ: CTTAY), Sumitomo Rubber Industries Ltd (NASDAQ: SMTUF), etc. and arrived at a target price of lower double-digit (in % terms). Hence, we recommend a “Buy” rating on the stock at the closing market price of $14.99, down 0.46% as on 08 January 2020. .jpg)
GT Daily Technical Chart (Source: Thomson Reuters)
Disclaimer
The advice given by Kalkine Canada Advisory Services Inc. and provided on this website is general information only and it does not take into account your investment objectives, financial situation and the particular needs of any particular person. You should therefore consider whether the advice is appropriate to your investment objectives, financial situation and needs before acting upon it. You should seek advice from a financial adviser, stockbroker or other professional (including taxation and legal advice) as necessary before acting on any advice. Not all investments are appropriate for all people. The website www.kalkine.ca is published by Kalkine Canada Advisory Services Inc. The link to our Terms & Conditions has been provided please go through them. On the date of publishing this report (mentioned on the website), employees and/or associates of Kalkine do not hold positions in any of the stocks covered on the website. These stocks can change any time and readers of the reports should not consider these stocks as advice or recommendations later.
 Please wait processing your request...