
Section 1: Company Overview and Fundamentals
1.1 Company Overview:
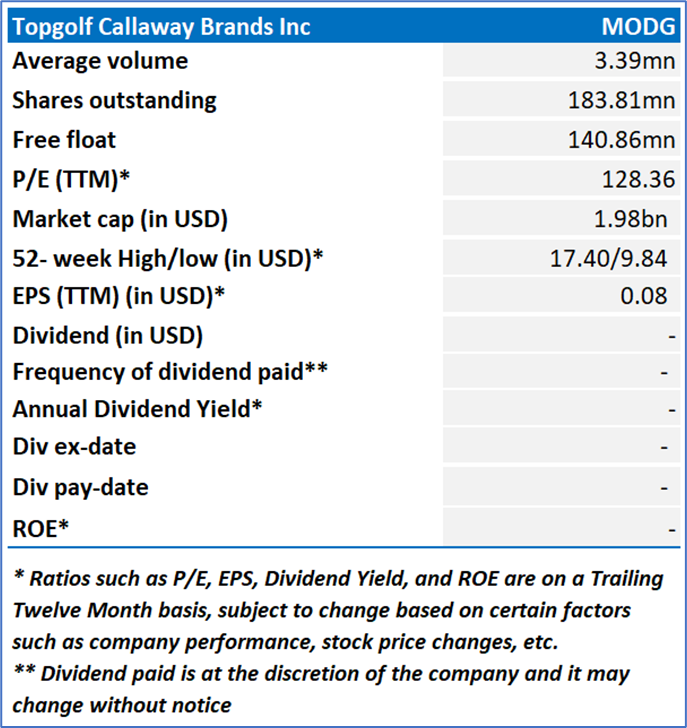
Topgolf Callaway Brands Corp. (NYSE: MODG) is a golf and active lifestyle company. The Company provides golf entertainment experiences, designs, and manufactures golf equipment, and sells golf and active lifestyle apparel and other accessories through its family of brand names, which include Topgolf, Callaway Golf, Odyssey, TravisMathew, Jack Wolfskin, OGIO, Toptracer and World Golf Tour. Its segments include Topgolf, Golf Equipment, and Active Lifestyle.
Kalkine’s Diversified Opportunities Report covers the Company Overview, Key positives & negatives, Investment summary, Key investment metrics, Top 10 shareholding, Business updates and insights into company recent financial results, Key Risks & Outlook, Price performance and technical summary, Target Price, and Recommendation on the stock.
Stock Performance:
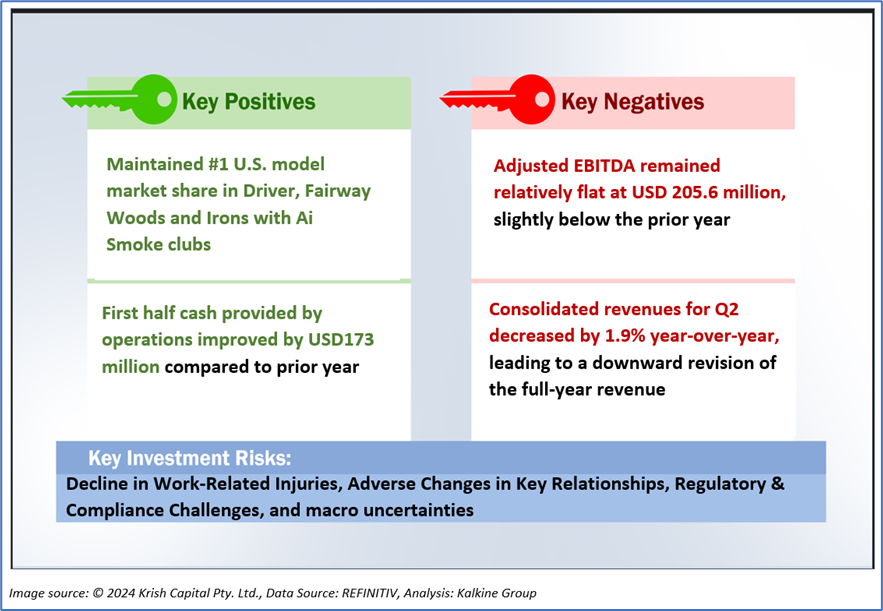
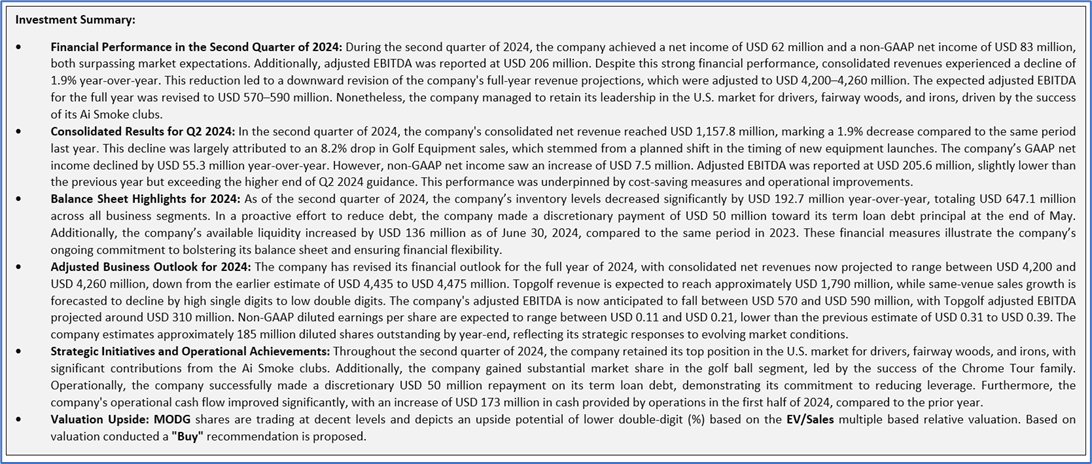
1.2 The Key Positives, Negatives, and Investment summary
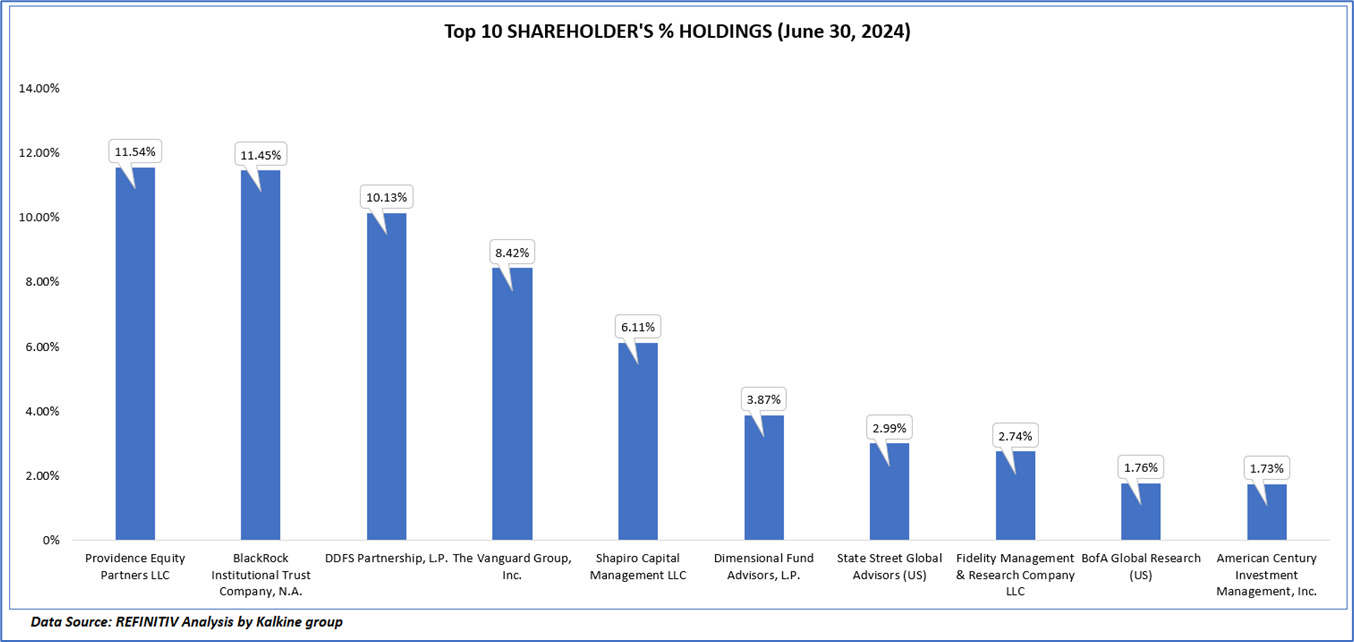
1.3 Top 10 shareholders:
The top 10 shareholders together form ~60.74% of the total shareholding, signifying concentrated shareholding. Providence Equity Partners LLC., and BlackRock Institutional Trust Company, N.A. are the biggest shareholders, holding the maximum stake in the company at 11.54% and 11.45%, respectively.
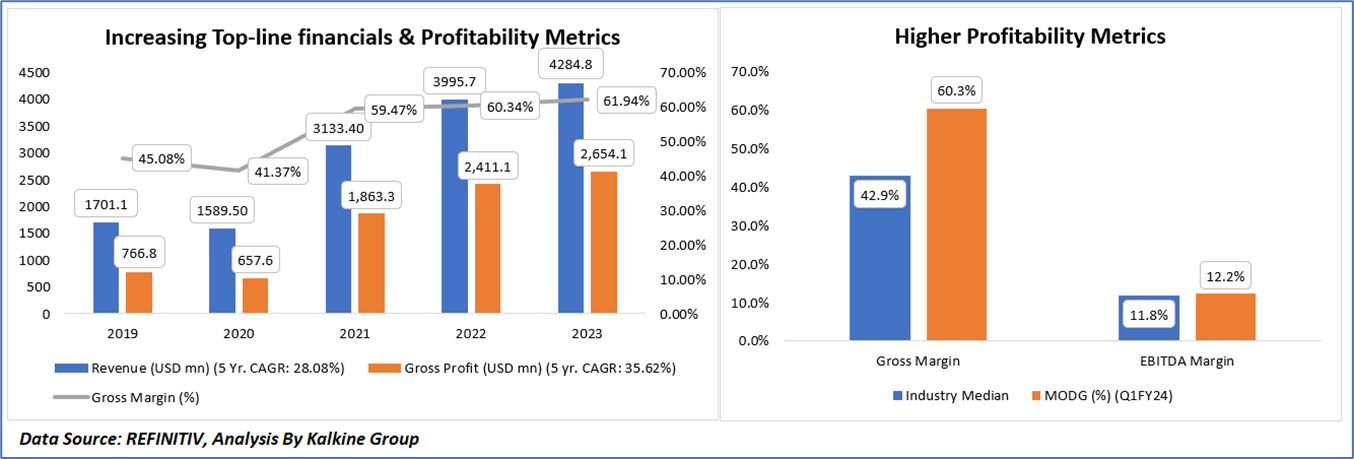
1.4 Key Metrics
Between 2019 and 2023, the company exhibited remarkable financial growth, with revenues increasing at a compound annual growth rate (CAGR) of 28.08%, rising from USD 1,701.1 million to USD 4,284.8 million. Concurrently, gross profit expanded at a five-year CAGR of 35.62%, from USD 766.8 million to USD 2,654.1 million. The company's gross margin improved from 45.08% to 61.94%, highlighting its strong cost management and operational efficiency. These metrics reflect the company's significant market presence and profitability. In Q1 FY2024, MODG achieved a gross margin of 60.3%, surpassing the industry median of 42.9%, indicative of superior cost control and pricing strategies. MODG's EBITDA margin for the same period stood at 12.2%, marginally above the industry median of 11.8%, further underscoring its operational effectiveness and ability to generate profitability above industry standards.
Section 2: Business Updates and Corporate Business Highlights
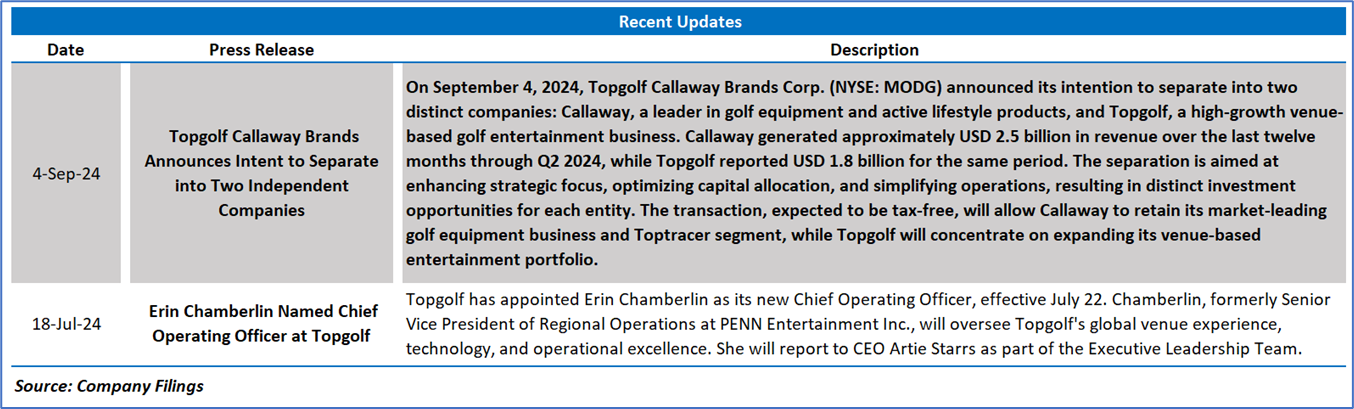
2.1 Recent Updates:
The below picture gives an overview of the recent updates:
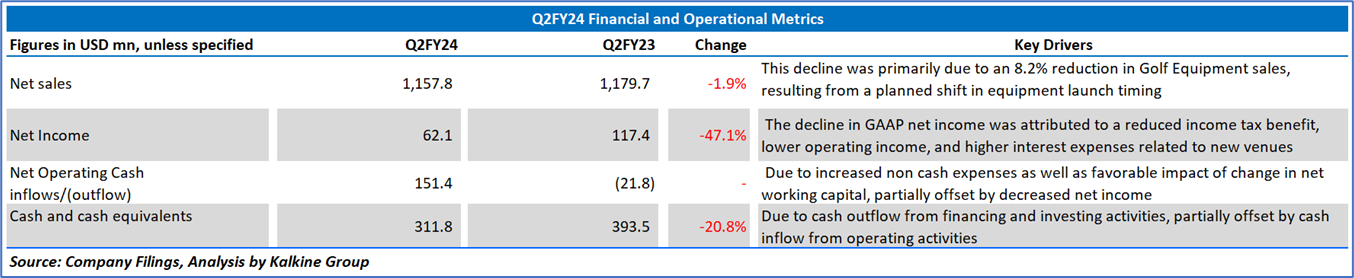
2.2 Insights of Q2FY24:
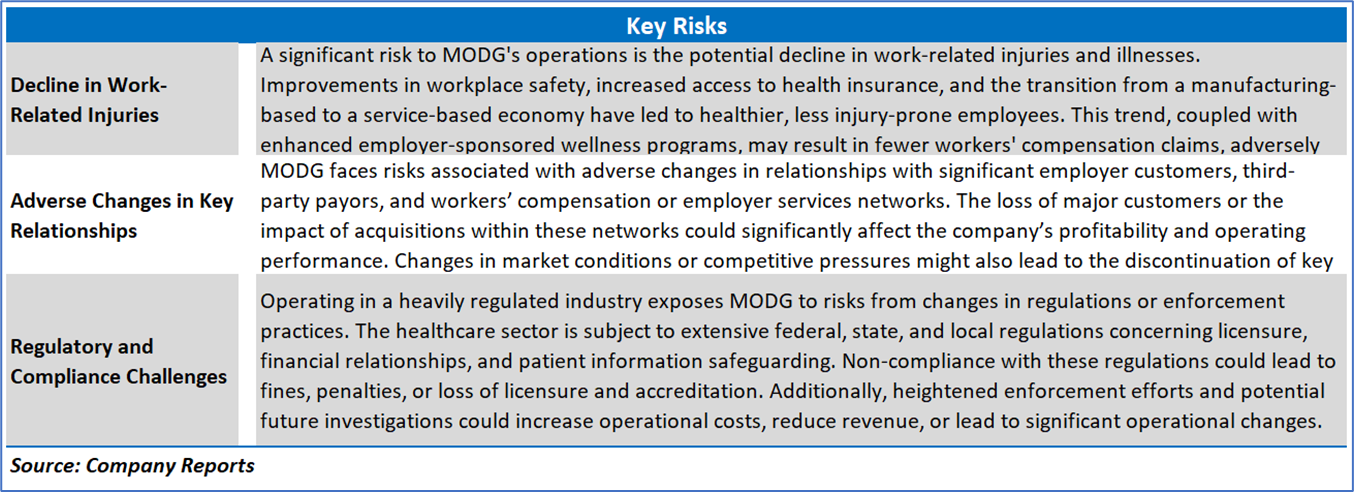
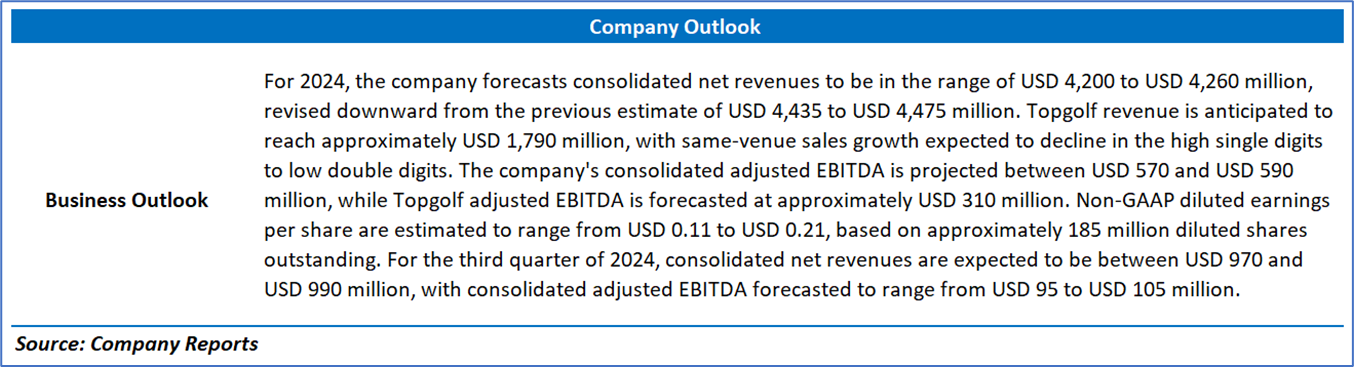
Section 3: Key Risks & Outlook
Section 4: Stock Recommendation Summary:
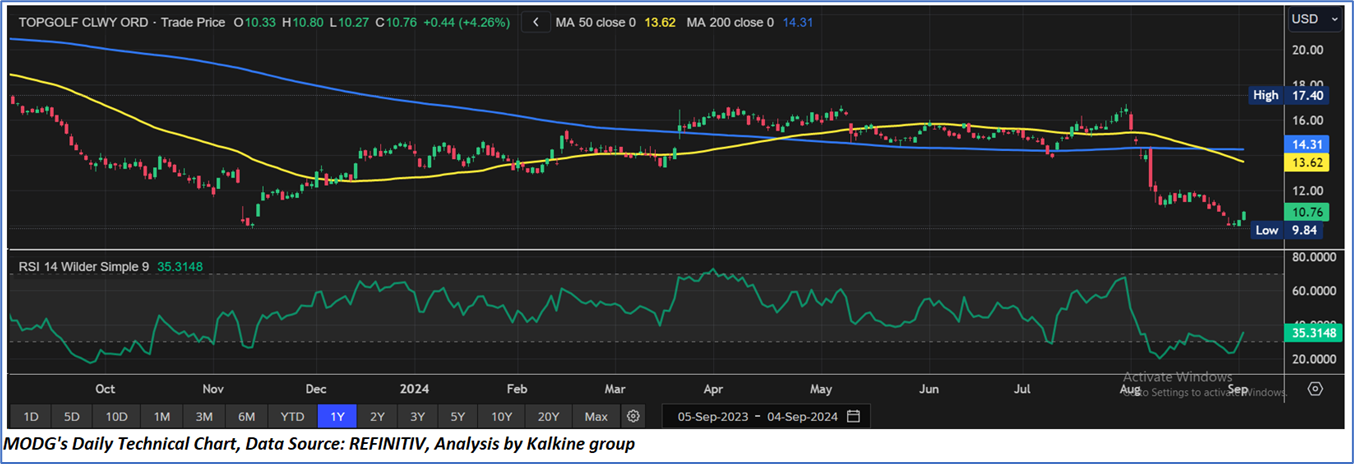
4.1 Price Performance and Technical Summary:
Stock Performance:
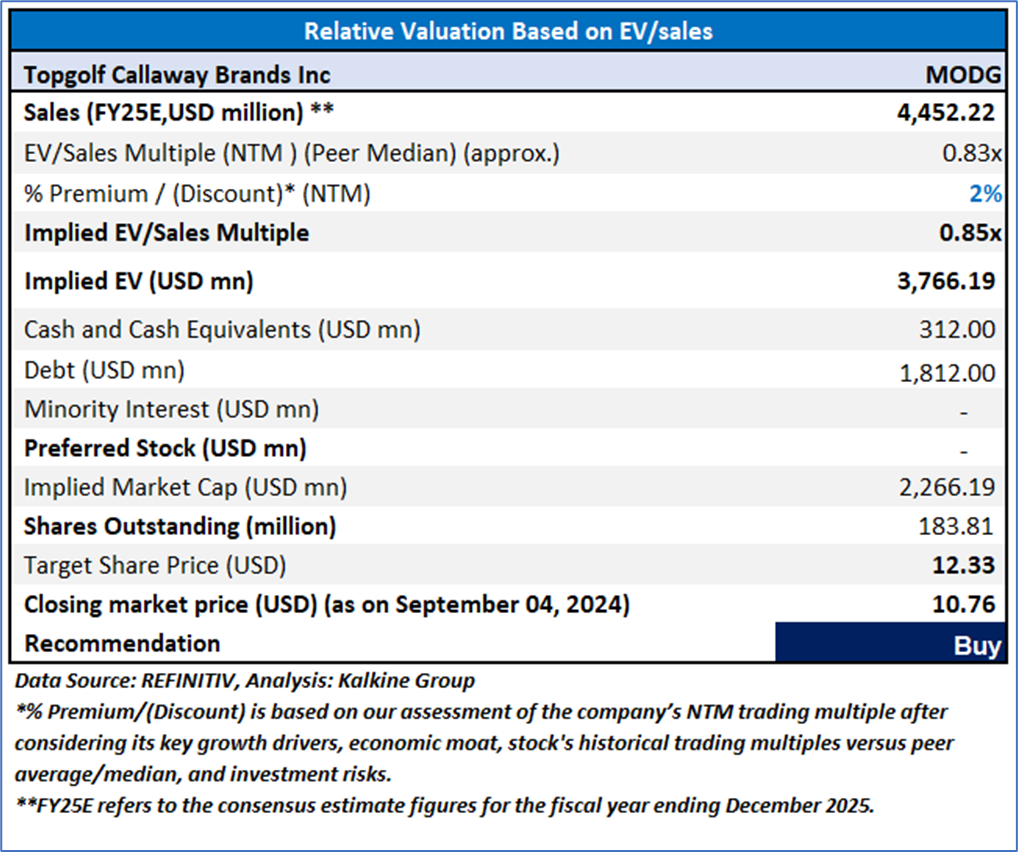
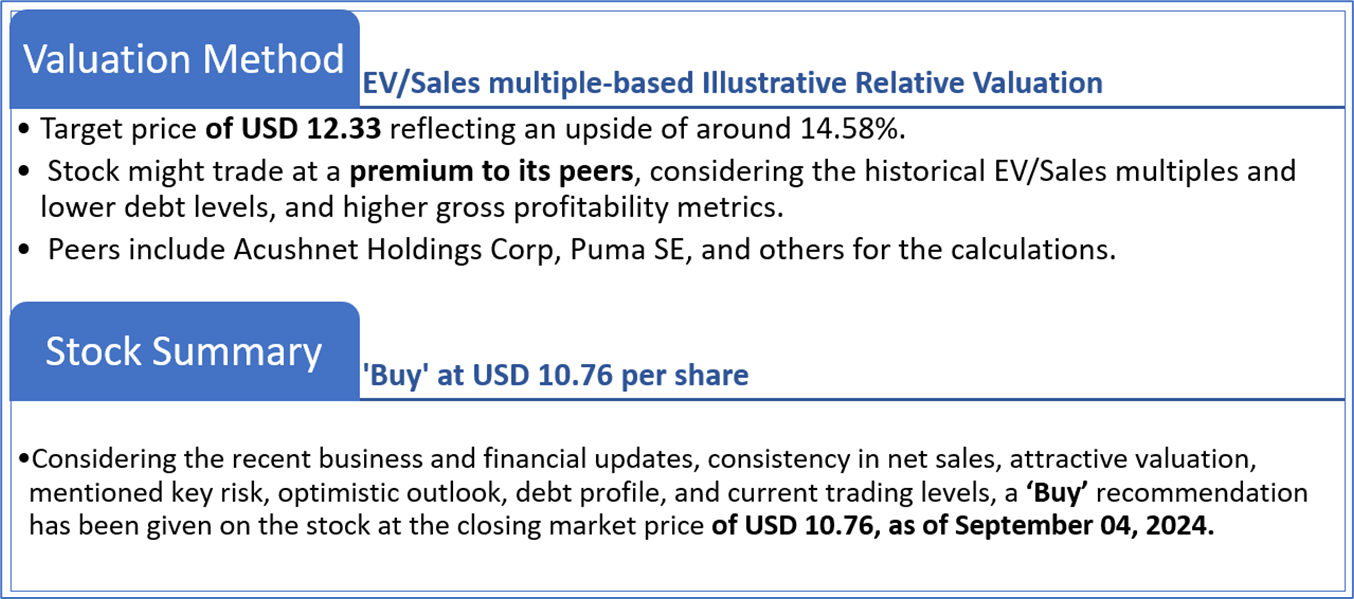
4.2 Fundamental Valuation
Valuation Methodology: EV/Sales Multiple Based Relative Valuation
Markets are trading in a highly volatile zone currently due to certain macroeconomic issues and geopolitical tensions prevailing. Therefore, it is prudent to follow a cautious approach while investing.
Note 1: Past performance is not a reliable indicator of future performance.
Note 2: The reference date for all price data, currency, technical indicators, support, and resistance levels is September 04, 2024. The reference data in this report has been partly sourced from REFINITIV.
Note 3: Investment decisions should be made depending on an individual's appetite for upside potential, risks, holding duration, and any previous holdings. An 'Exit' from the stock can be considered if the Target Price mentioned as per the Valuation and or the technical levels provided has been achieved and is subject to the factors discussed above.
Note 4: The report publishing date is as per the Pacific Time Zone.
Technical Indicators Defined: -
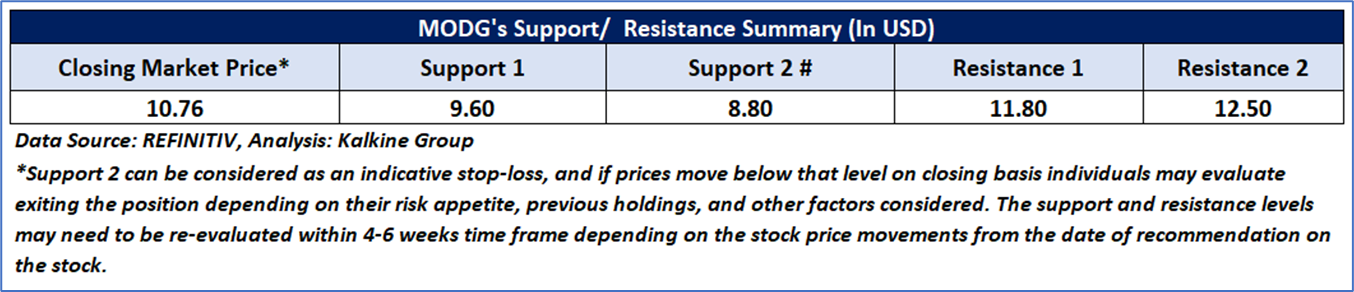
Support: A level at which the stock prices tend to find support if they are falling, and a downtrend may take a pause backed by demand or buying interest. Support 1 refers to the nearby support level for the stock and if the price breaches the level, then Support 2 may act as the crucial support level for the stock.
Resistance: A level at which the stock prices tend to find resistance when they are rising, and an uptrend may take a pause due to profit booking or selling interest. Resistance 1 refers to the nearby resistance level for the stock and if the price surpasses the level, then Resistance 2 may act as the crucial resistance level for the stock.
Stop-loss: It is a level to protect against further losses in case of unfavorable movement in the stock prices.
The advice given by Kalkine Canada Advisory Services Inc. and provided on this website is general information only and it does not take into account your investment objectives, financial situation and the particular needs of any particular person. You should therefore consider whether the advice is appropriate to your investment objectives, financial situation and needs before acting upon it. You should seek advice from a financial adviser, stockbroker or other professional (including taxation and legal advice) as necessary before acting on any advice. Not all investments are appropriate for all people. The website www.kalkine.ca is published by Kalkine Canada Advisory Services Inc. The link to our Terms & Conditions has been provided please go through them. On the date of publishing this report (mentioned on the website), employees and/or associates of Kalkine do not hold positions in any of the stocks covered on the website. These stocks can change any time and readers of the reports should not consider these stocks as advice or recommendations later.
 Please wait processing your request...