
Company Overview: Exxon Mobil Corporation (NYSE: XOM) is an international energy and petrochemical company. Its primary businesses include exploration for, and production of, crude oil and natural gas. Trip.com Group Ltd (NASDAQ: TCOM) is a China-based company mainly engaged in the operation of one-stop travel platform. The Company's platform integrates a comprehensive suite of travel products and services and differentiated travel content. This Report covers the Price Action, Technical Indicators Analysis along with the Target Levels, Stop Loss, Support Levels, Resistance Levels, and Recommendations on these two stocks.
US Markets Round-Up
This week, the Russell 3000 index, an important benchmark of the US stock market across market capitalizations, started the week on a negative note and continued the momentum. The index made a low of 3282.763 during the week and settled at 3244.014 with a week-to-date (WTD) loss of ~0.764 percent on Oct 3, 2024. Other major indices, such as S&P 500 and NASDAQ Composite, witnessed negative movement for the week. On Oct 3, 2024, the S&P 500 index settled at ~5699.95 with a WTD loss of ~0.67 percent, while the NASDAQ Composite Index settled at 17918.476 with a WTD loss of ~1.11 percent.
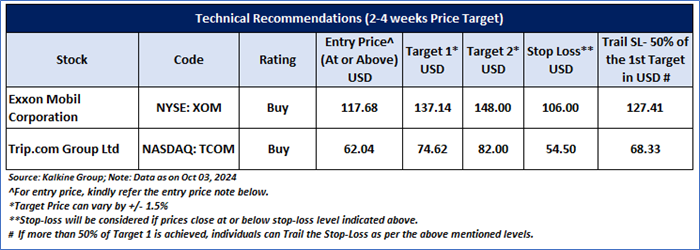
Having understood the US market performance over the week, taking cues from major global news, and based on technical analysis of the Russell 3000 index for the upcoming week, now let’s have a look at the two US-listed stocks to pick from the technical standpoint. Noted below recommendations are based on the entry price, target prices, and stop-loss for Exxon Mobil Corporation (NYSE: XOM) and Trip.com Group Ltd (NASDAQ: TCOM) for the next 2-4 weeks duration:
Exxon Mobil Corporation (NYSE: XOM)
Noted below are the key price indicators for the stock:

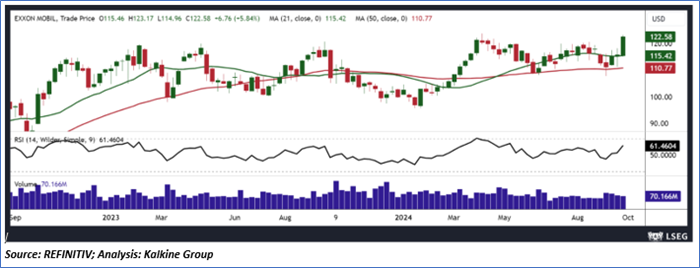
Price Action Analysis (on the Weekly Chart)
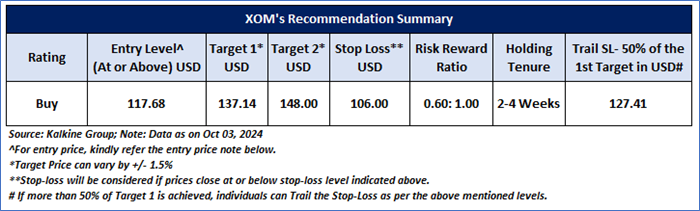
XOM’s stock price has recently rebounded, finding support at key levels and subsequently rising higher, suggesting a potential for further upward movement. The stock's current trajectory is expected to continue, with the next significant hurdle appearing at a price of USD 137.14. Over the next 2-4 weeks, it is likely that the stock will test this level, potentially triggering a reaction. If the stock is able to break above USD 137.14, it may lead to further buying momentum, potentially extending the stock's upward movement.
Technical Indicators Analysis (On the Weekly Chart)
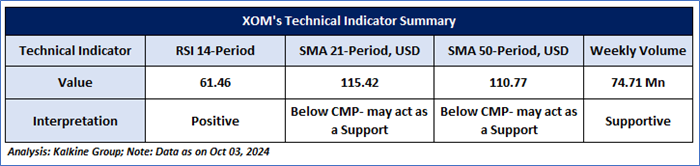
On the daily chart, the leading indicator RSI (14-period) is moving above the midpoint and shows a reading of 61.46, supporting positive bias. Moreover, the prices are trading above the trend-following indicators 21-period SMA and 50-period SMA, which may act as the dynamic support level in the near term.
General Recommendation
As per the above-mentioned price action and technical indicators analysis, Exxon Mobil Corporation (NYSE: XOM) is looking technically well-placed on the chart, and a ‘Buy’ recommendation has been given on the stock. Investment decision should be made depending on an individual’s appetite for upside potential, risks, and any previous holdings. This recommendation is purely based on technical analysis, and fundamental analysis has not been considered in this report. The summary of recommendations is as follows:
Trip.com Group Ltd (NASDAQ: TCOM)
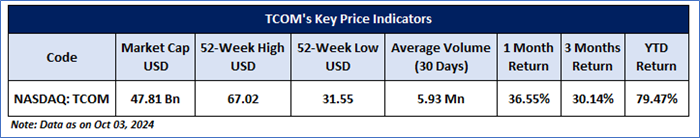
Noted below are the key price indicators for the stock:
Price Action Analysis (on the Weekly Chart)
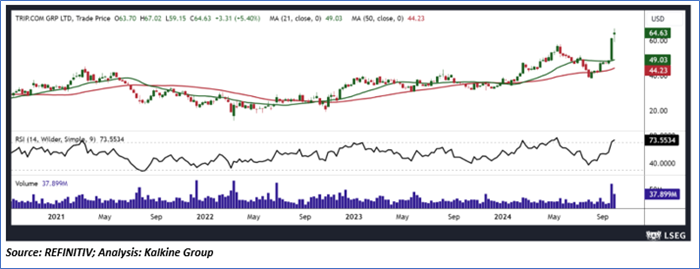
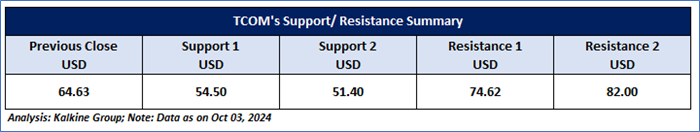
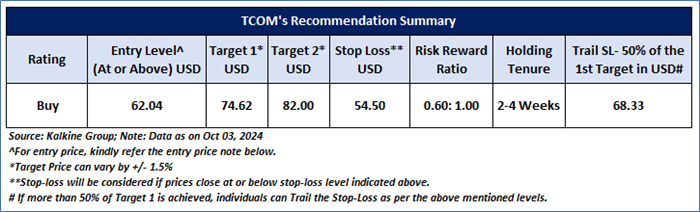
TCOM's stock price has experienced a notable upward trend, indicating the potential for additional gains. The stock's current path suggests that it will likely maintain this momentum, with the next key resistance level identified at USD 74.62. Within the next 2-4 weeks, the stock is expected to challenge this threshold, potentially eliciting a response. Should the stock successfully surpass USD 74.62, it could generate increased buying activity, further extending its upward trajectory.
Technical Indicators Analysis (On the Weekly Chart)
On the weekly chart, the leading indicator RSI (14-period) is moving northward and shows a reading of 73.55, supporting the positive bias. The volumes also seem supportive of the next upside movement. Moreover, the prices are trading above the trend-following indicators 21-period and 50-period SMAs, which may act as the dynamic support levels in the near term.

General Recommendation
As per the above-mentioned price action and technical indicators analysis, Trip.com Group Ltd (NASDAQ: TCOM) is looking technically well-placed on the chart, and a ‘Buy’ recommendation has been given on the stock. Investment decision should be made depending on an individual’s appetite for upside potential, risks, and any previous holdings. This recommendation is purely based on technical analysis, and fundamental analysis has not been considered in this report. The summary of recommendations is as follows:
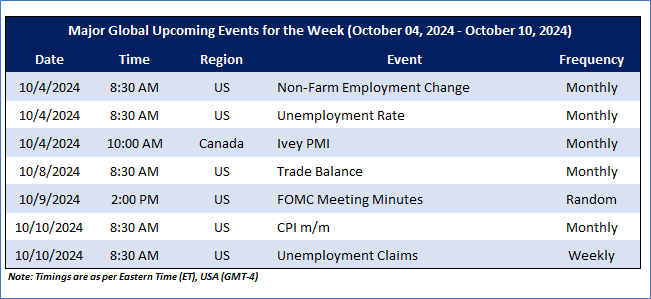
Upcoming Major Global Economic Events
Market events occur on a day-to-day basis depending on the frequency of the data and generally include an updates CPI, PMI, Unemployment Data, etc. Noted below are the upcoming week's major global economic events that could impact the Russell 3000 Index and stocks’ prices:
Related Risks: This report may be looked at from a high-risk perspective and recommendations are provided for a short duration. Recommendations provided in this report are solely based on technical parameters, and the fundamental performance of the stocks has not been considered in the decision-making process. Other factors which could impact the stock prices include market risks, regulatory risks, interest rates risks, currency risks, social and political instability risks etc.
Note 1: Individuals can consider exiting from the stock if the Target Price or Stop loss mentioned as per the technical analysis has been achieved and subject to the factors discussed above.
Note 2: How to Read the Charts?
The Green colour line reflects the 21-period moving average while the red line indicates the 50- period moving average. SMA helps to identify existing price trends. If the prices are trading above the 21-period and 50-period moving average, then it shows prices are currently trading in a bullish trend.
The Black colour line in the chart's lower segment reflects the Relative Strength Index (14-Period) which indicates price momentum and signals momentum in trend. A reading of 70 or above suggests overbought status, while a reading of 30 or below suggests an oversold status.
The Blue colour bars in the chart’s lower segment show the volume of the stock. The volume is the number of shares that changed hands during a given day. Stocks with high volumes are more liquid than stocks with lesser volume as liquidity in stocks helps in easier and faster execution of the order.
The Orange colour lines are the trend lines drawn by connecting two or more price points and used for trend identification purposes. The trend line also acts as a line of support and resistance.
Technical Indicators Defined: -
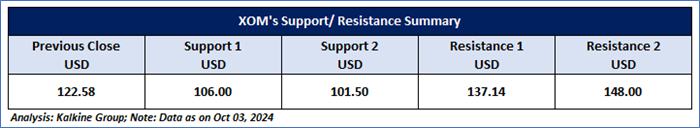
Support: A level at which the stock prices tend to find support if they are falling, and a downtrend may take a pause backed by demand or buying interest. Support 1 refers to the nearby support level for the stock, and if the price breaches the level, then Support 2 may act as the crucial support level for the stock.
Resistance: A level at which the stock prices tend to find resistance when they are rising, and an uptrend may take a pause due to profit booking or selling interest. Resistance 1 refers to the nearby resistance level for the stock, and if the price surpasses the level, then Resistance 2 may act as the crucial resistance level for the stock.
Stop-loss: It is a level to protect further losses in case of unfavourable movement in the stock prices.
Risk Reward Ratio: Risk reward ratio is the difference between an entry point to a stop loss and profit level. This report is based on ~60% Stop Loss of the Target 1 from the entry point.
A trailing stop-loss is a modification of stop-loss in case of favourable movement in the price to protect the gains. Individuals can Trail the Stop-Loss as per the aforementioned levels if the stock price achieves more than 50% of the Target 1. Individuals should consider exiting from the position as per the Trailing Stop-Loss level if the price starts moving downwards after achieving more than 50% of the Target 1.
The reference date for all price data, currency, technical indicators, support, and resistance levels Oct 3, 2024. The reference data in this report has been partly sourced from REFINITIV.
Abbreviations
CMP: Current Market Price
SMA: Simple Moving Average
RSI: Relative Strength Index
USD: United States dollar
Note: Trading decisions require a thorough analysis by individuals. Technical reports in general chart out metrics that may be assessed by individuals before any stock evaluation. The above are illustrative analytical factors used for evaluating the stocks; other parameters can be looked at along with additional risks per se. Past performance is neither an indicator nor a guarantee of future performance.
The advice given by Kalkine Canada Advisory Services Inc. and provided on this website is general information only and it does not take into account your investment objectives, financial situation and the particular needs of any particular person. You should therefore consider whether the advice is appropriate to your investment objectives, financial situation and needs before acting upon it. You should seek advice from a financial adviser, stockbroker or other professional (including taxation and legal advice) as necessary before acting on any advice. Not all investments are appropriate for all people. The website www.kalkine.ca is published by Kalkine Canada Advisory Services Inc. The link to our Terms & Conditions has been provided please go through them. On the date of publishing this report (mentioned on the website), employees and/or associates of Kalkine do not hold positions in any of the stocks covered on the website. These stocks can change any time and readers of the reports should not consider these stocks as advice or recommendations later.
 Please wait processing your request...