
Cloudflare Inc
NET Details
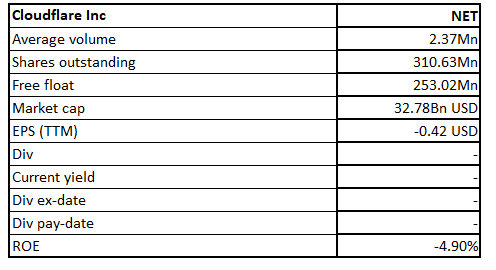
Cloudflare Inc (NYSE: NET) is a global cloud services provider and is engaged in providing products that protect and boost internet application online without the addition of hardware, software, or changes in line of code.
Q1FY21 Results Performance (For the Period Ended 31 March 2021)
Revenue Rose 51% YoY: The company has recorded a 51% YoY growth in revenue to $138.1 million. It recorded a record dollar-based net retention of 123% that reflects a growth of 600 basis points YoY.
Increase in Net Loss: It has posted an increase in its net loss to $40.0 million in GAAP terms from a net loss of $32.7 million in Q1FY20. While in Non-GAAP terms, the net loss for the quarter stood at $9.3 million against $12.3 million in the same quarter last year.
Inclusion of Large Customers Remained Robust: The company has witnessed a robust growth in its large customer base, with a record addition of around 120 large customers. Large customers currently account for more than 50% of revenue of the company.
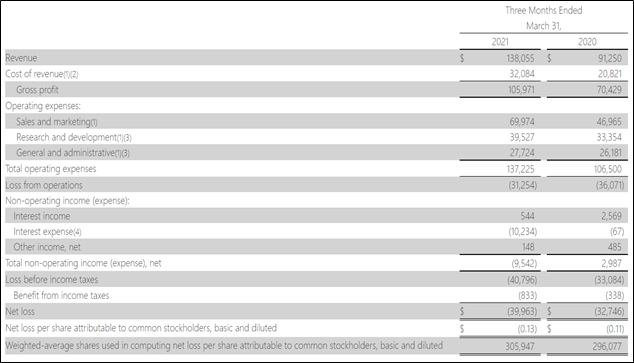
Consolidated Income Statement (Source: Company Reports)
Integration with Microsoft, Splunk, Datadog, and Sumo Logic
The company, on 22 June 2021, declared that it has integrated with Microsoft Azure Sentinel, Splunk®, Datadog, and Sumo Logic to assist businesses to easily connect and analyze key insights across their infrastructure without incurring additional cost or complexity of building custom integrations.
Set Up First Office in Canada
The company, on 19 April 2021, informed the opening of its first office in Canada to support its accelerating customer base. Its team and operations in Canada will focus on increasing brand awareness, assist, and acquire customers, and on-boarding local talent.
Outlook
With robust global networks in place, the company continues to provide business-critical offerings and displace point solutions. The company has guided its revenue to stay between $145.5 to $146.5 million and non-GAAP loss from operations in the range of $10 to $9 million in Q2FY21. Further, it anticipates of achieving overall revenue in the range of $612 to $616 million and non-GAAP loss from operations between $28 to $24 million in FY21.
Key Risks
The company is exposed to the risks associated with attracting and retaining new customers (including new large customers). Further, rapidly evolving technological developments and length of sales cycles are some other potential risks.
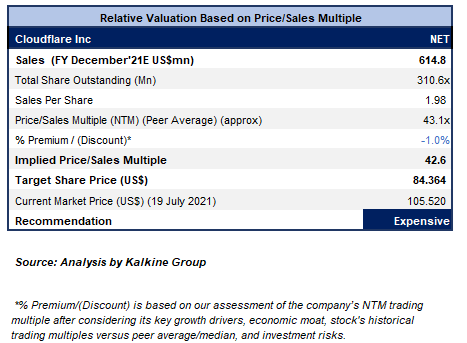
Valuation Methodology: Price/Sales Based Relative Valuation (Illustrative)
Technical Overview:
Weekly Chart –
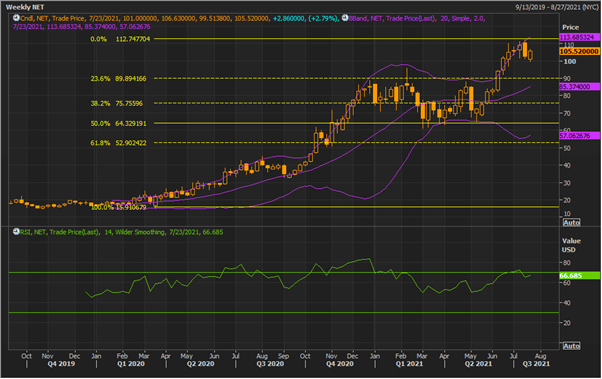
Source: REFINITIV
Note: Purple colour lines are Bollinger Bands® with the upper band suggesting overbought status while the lower band oversold status, and yellow lines are Fibonacci retracement lines which measure price rebound and backtrack. https://www.bollingerbands.com/
Having made a high of $112.75, the stock came into selling pressure and drove it down to close at the low price in the previous week. The technical indicator RSI with a reading around 67 suggests softening of bullish momentum for the stock.
Going forward, the stock may have resistance around the previous high of $112.75 whereas support could be around the 23.6% retracement level of $89.89.
Stock Recommendation
We have valued the stock using a Price/Sales multiple-based illustrative relative valuation and have arrived at a target price that reflects a fall of low double-digit (in % terms). We have assigned a slight discount to Price/Sales Multiple (NTM) (Peer Average) considering negative margins as well as negative returns.
Considering the aforementioned factors, along with its current high trading levels, we believe the stock is presently “Expensive” at the current market price of $105.52 per share, up by 2.786% on 19th July 2021.
Aurinia Pharmaceuticals Inc
AUPH Details
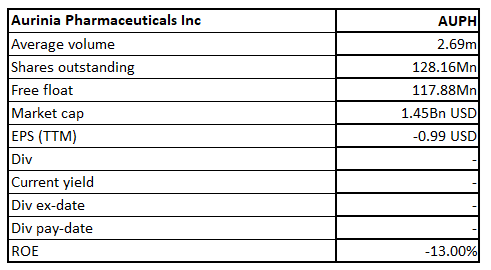
Aurinia Pharmaceuticals Inc (NASDAQ: AUPH) is a clinical biopharmaceutical company and is engaged in developing and commercializing therapies to cure patients who are impacted by serious diseases with a high unmet medical need.
Q1FY21 Results Performance (For the Period Ended 31 March 2021)
Increase in Revenue: The company has generated revenue of $0.9 million in Q1 FY 2021 as compared to the revenue of $30 thousand in Q1 FY 2020 driven by the commencement of the commercial sales of LUPKYNIS in January 2021.
Gross Margin at 95%: AUPH has incurred cost of sales of $48 thousand during the quarter owing to the commercial sales of LUPKYNIS and drug substance. The gross margin for the quarter stood at around 95%.
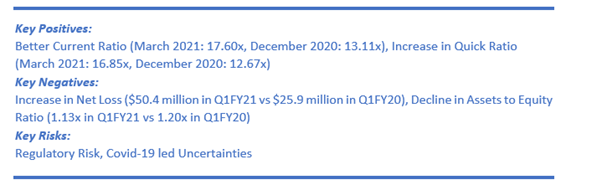
Spike in Net Loss: It has registered an increase in its net loss to $50.4 million from a net loss of $25.9 million in the pcp.
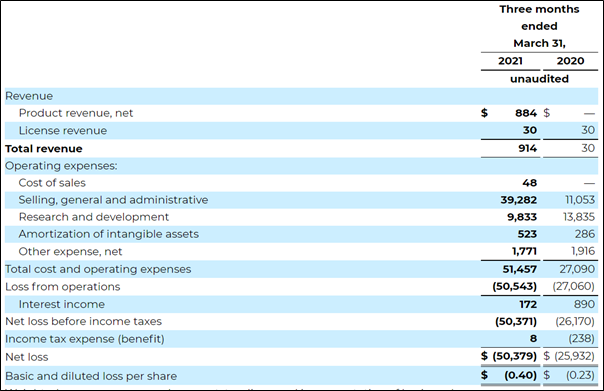
Consolidated Income Statement (Source: Company Reports)
Delisting from Toronto Stock Exchange
The company, on 16 July 2021, declared the voluntarily delisting of its shares from the Toronto Stock Exchange (TSX) effective from July 30, 2021.
Filed Initial Marketing Authorization Application for Voclosporin with the European Medicines Agency
The company, on 25 June 2021, updated that its licensing partner Otsuka has filed the initial Marketing Authorization Application (MAA) with the European Medicines Agency (EMA) for Voclosporin for curing lupus nephritis (LN).
Awarded $250,000 in Grants to Assist Patient Navigation Programs
AUPH, on 30 June 2021, declared that it has awarded five $50,000 grant awards to five patient organisations to assist the execution of patient navigation programs aimed at disadvantaged populations at most risk of developing SLE and LN.
Outlook
Following the commercial launch of LUPKYNIS in Q1FY21, the LUPKYNIS trajectory is on track against its internal estimates. It expects a further increase in its market access driven by an acceleration in the COVID vaccinations in the United States and the opening of healthcare centers. Meanwhile, it estimates to achieve top-line results from the ongoing AURORA-2 continuation study in Q1FY22.
Besides, it has healthy cash and cash equivalents and investments of $360.9 million as of 31 March 2021. The company highlighted that the healthy liquidity position will assist in funding commercial activities, including its FDA related post approval commitments, manufacturing and packaging of commercial drug supply, exploring R&D activities, and operating activities till 2023.
Key Risks
The company is exposed to risks of the evolving and uncertain impacts of the COVID-19 pandemic. Further, it is exposed to the risk of its limited number of customers and patients’ base.
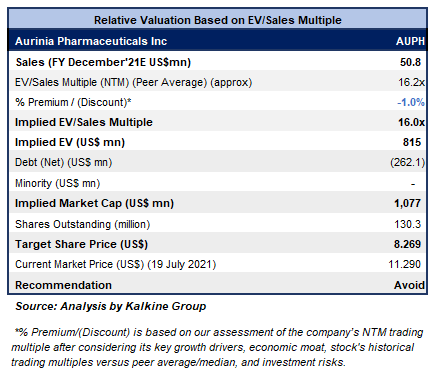
Valuation Methodology: EV/Sales Based Relative Valuation (Illustrative)
Technical Overview:
Weekly Chart –
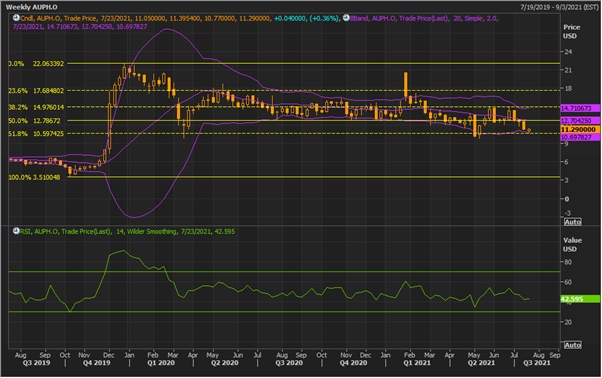
Source: REFINITIV
Note: Purple colour lines are Bollinger Bands® with the upper band suggesting overbought status while the lower band oversold status, and yellow lines are Fibonacci retracement lines which measure price rebound and backtrack. https://www.bollingerbands.com/
While experiencing low volatility, the stock has given a flattish close at $11.29 for the ongoing week. The technical indicator RSI with a reading around 43 suggests neutral momentum for the stock.
Going forward, the stock may have resistance around the converging point of the 50% retracement level and 20 periods SMA of $12.75 whereas support could be around $9.50.
Stock Recommendation
We have valued the stock using an EV/Sales multiple-based illustrative relative valuation and have arrived at a target price that reflects a fall of low double-digit (in % terms). We have assigned a slight discount to EV/Sales Multiple (NTM) (Peer Average) considering its negative EBITDA and Net Margins in Q1FY21 as well as negative ROE of -13.0% in Q1FY21.
The company has already declared that it plans to get voluntarily delisted from the Toronto Stock Exchange (TSX).
Considering the aforementioned factors, and its associated business risks, we advise the market players to “Avoid” the stock at the current market price of $11.29 per share, up by 0.36% on 19th July 2021.
Note 1: The reference data in this report has been partly sourced from REFINITIV.
Note 2: Investment decisions should be made depending on the investors’ appetite on upside potential, risks, holding duration, and any previous holdings. Investors can consider exiting from the stock if the Target Price mentioned as per the analysis has been achieved and subject to the factors discussed above alongside support levels provided.
Technical Indicators Defined:-
Support: A level where-in the stock prices tend to find support if they are falling, and downtrend may take a pause backed by demand or buying interest.
Resistance: A level where-in the stock prices tend to find resistance when they are rising, and uptrend may take a pause due to profit booking or selling interest.
Disclaimer
The advice given by Kalkine Canada Advisory Services Inc. and provided on this website is general information only and it does not take into account your investment objectives, financial situation and the particular needs of any particular person. You should therefore consider whether the advice is appropriate to your investment objectives, financial situation and needs before acting upon it. You should seek advice from a financial adviser, stockbroker or other professional (including taxation and legal advice) as necessary before acting on any advice. Not all investments are appropriate for all people. The website www.kalkine.ca is published by Kalkine Canada Advisory Services Inc. The link to our Terms & Conditions has been provided please go through them. On the date of publishing this report (mentioned on the website), employees and/or associates of Kalkine do not hold positions in any of the stocks covered on the website. These stocks can change any time and readers of the reports should not consider these stocks as advice or recommendations later.
 Please wait processing your request...