
Shoals Technologies Group, Inc.

SHLS Details
Shoals Technologies Group Inc (NASDAQ: SHLS) is the provider of electrical balance of system or EBOS solutions for solar energy projects, primarily in the United States.
Financial Results
Key Update
SHLS announced that the company would be releasing its Q4 FY 2023 results after market close on February 28, 2024.
Outlook
For FY 2023, SHLS is expecting revenue of between $485 Mn - $495 Mn and adjusted EBITDA of between $165 Mn - $175 Mn. Adjusted net income of the company is expected between $110 Mn - $120 Mn.
Key Risks
Lower than expected growth in demand for solar energy projects as well as EV charging infrastructure, failure to recover the costs and expenses, etc. are some of the risks.
Fundamental Valuation
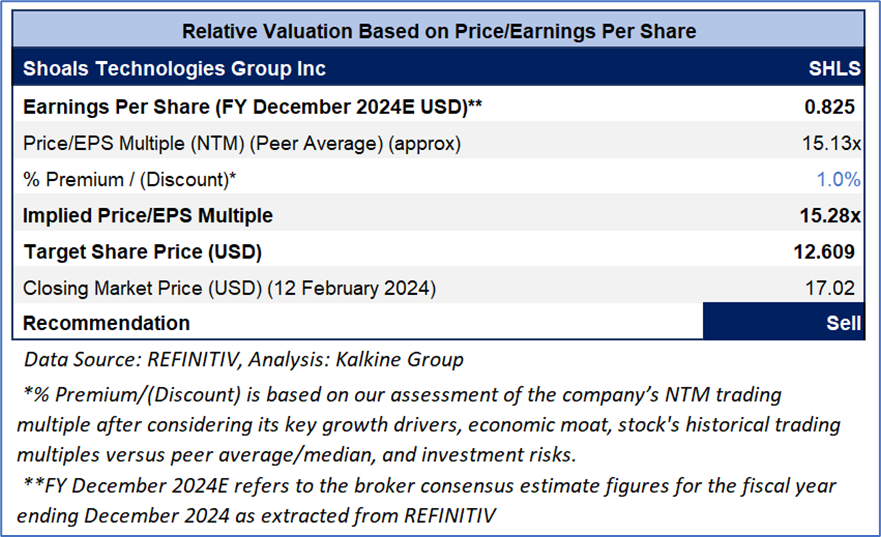
Stock Recommendation
Over the last three months, the stock has given a return of 25.7%. The stock has made a 52-week low and high of USD 12.11 and USD 28.34, respectively. The company’s performance is exposed to the risks related to the global slowdown as well as geopolitical tensions. Also, macroeconomic events, such as heightened inflation, higher interest rates as well as the potential recession could impact its business. Notably, supply chain challenges, due to additional duties and charges on imports and exports, could impact operations. Therefore, investors should exit the stock.
Hence, a ‘Sell’ rating has been provided on the stock at the closing price of USD 17.02 per share, up by 3.15% as on 12th February 2024.
Technical Overview:
Daily Price Chart
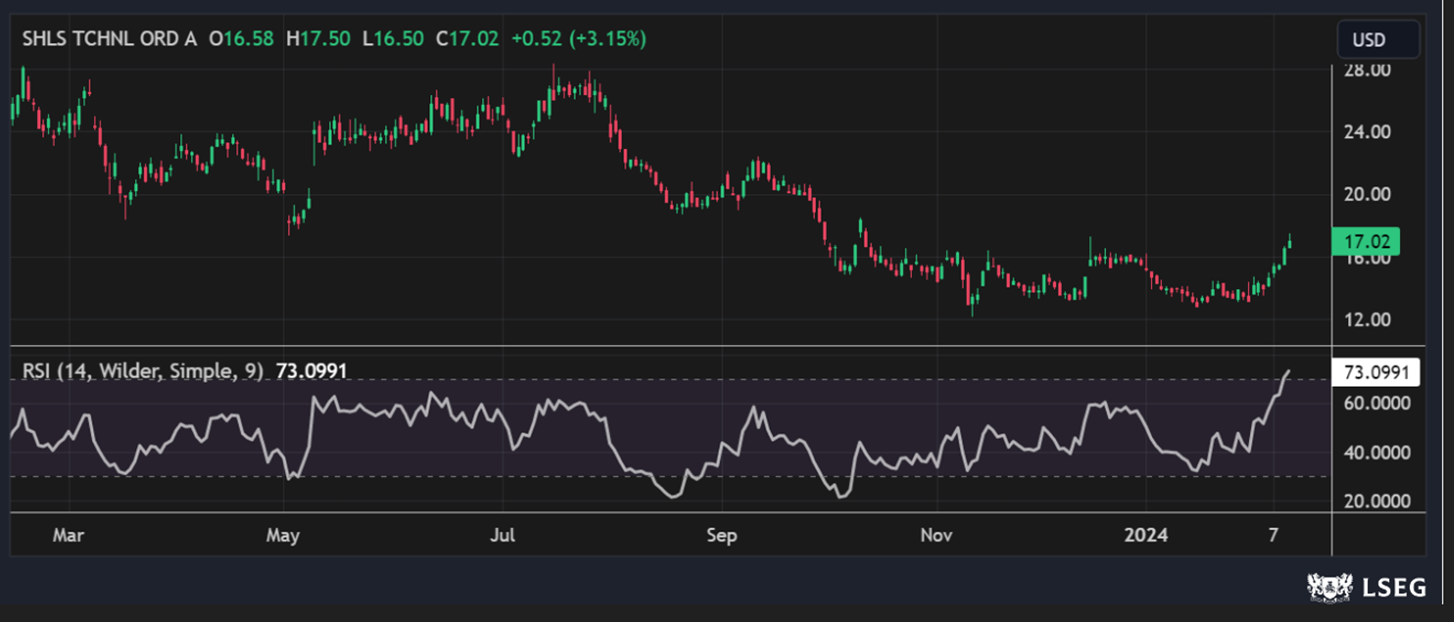
SHLS Daily Technical Chart, Data Source: REFINITIV
Markets are trading in a highly volatile zone currently due to certain macro-economic and geopolitical tensions prevailing. Therefore, it is prudent to follow a cautious approach while investing.
Note 1: Past performance is neither an indicator nor a guarantee of future performance.
Note 2: The reference date for share price chart and stock valuation is based on February 12, 2024. The reference data in this report has been partly sourced from REFINITIV.
Note 3: Investment decisions should be made depending on an individual's appetite for upside potential, risks, holding duration, and any previous holdings. An 'Exit' from the stock can be considered if the Target Price mentioned as per the Valuation and or the technical levels provided has been achieved and is subject to the factors discussed above.
The advice given by Kalkine Canada Advisory Services Inc. and provided on this website is general information only and it does not take into account your investment objectives, financial situation and the particular needs of any particular person. You should therefore consider whether the advice is appropriate to your investment objectives, financial situation and needs before acting upon it. You should seek advice from a financial adviser, stockbroker or other professional (including taxation and legal advice) as necessary before acting on any advice. Not all investments are appropriate for all people. The website www.kalkine.ca is published by Kalkine Canada Advisory Services Inc. The link to our Terms & Conditions has been provided please go through them. On the date of publishing this report (mentioned on the website), employees and/or associates of Kalkine do not hold positions in any of the stocks covered on the website. These stocks can change any time and readers of the reports should not consider these stocks as advice or recommendations later.
 Please wait processing your request...