
Hormel Foods Corporation
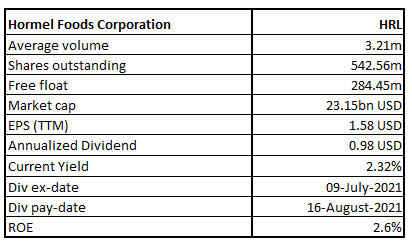
HRL Details
Hormel Foods Corporation (NYSE: HRL) is in the business of processing branded and unbranded food products for retail, foodservice, deli and commercial customers. It operates in four segments including Grocery Products, Refrigerated Foods, Jennie-O Turkey Store and International & Other.
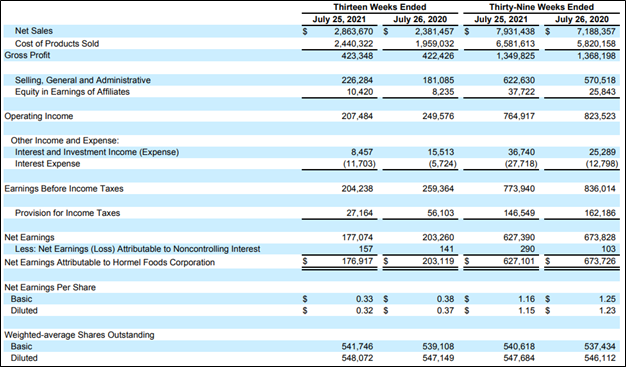
Result Performance for the Third Quarter Ended 25 July 2021 - (Q3FY21)
Key Data (Source: Company Reports)
Outlook:
Elevated Demand: The company delivered 25% sales growth over pre-pandemic levels which reflects on an expanded product portfolio and increased sales and distribution channel. Further, the investments made in the retail, deli, and e-commerce in the initial phases of the pandemic last year helped customers serve better as they migrated to more at-home eating occasions.
The leadership positions of the company in foodservice and snacking have supported an acceleration in growth as consumers pivot to spending additional time in restaurants, traveling, and gatherings with family and friends. In order to offset inflationary pressure on its business, the company has taken several measures including optimizing promotional activities, improving product mix and rationalizing less efficient products in its portfolio.
Revised FY21 Guidance: The company has provided its full year FY21 sales guidance which is expected in the range of $11.0-$11.2 billion and has reaffirmed its earnings per share guidance range of $1.65-$1.69 per share, considering the acquisition of the Planters snack nuts business.
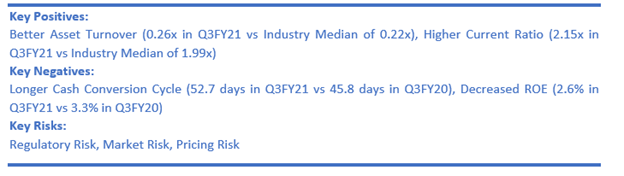
Key Risks:
The uncertain and rapidly changing COVID-19 environment could adversely impact the company’s business, financial position, and operations. Further, the company is exposed to the risk of disruption of operations at co-manufacturers, suppliers, or other third-party service providers. Deterioration of labor relations or rise in labor costs could harm the company’s Business.
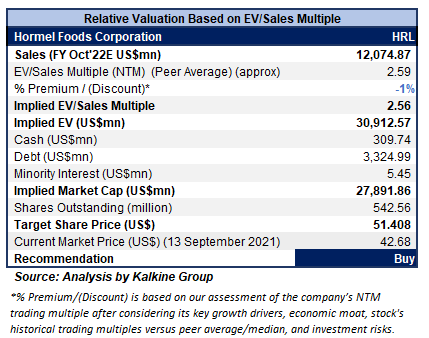
Valuation Methodology: EV/Sales based Relative Valuation (Illustrative)
Technical Overview:
Chart:
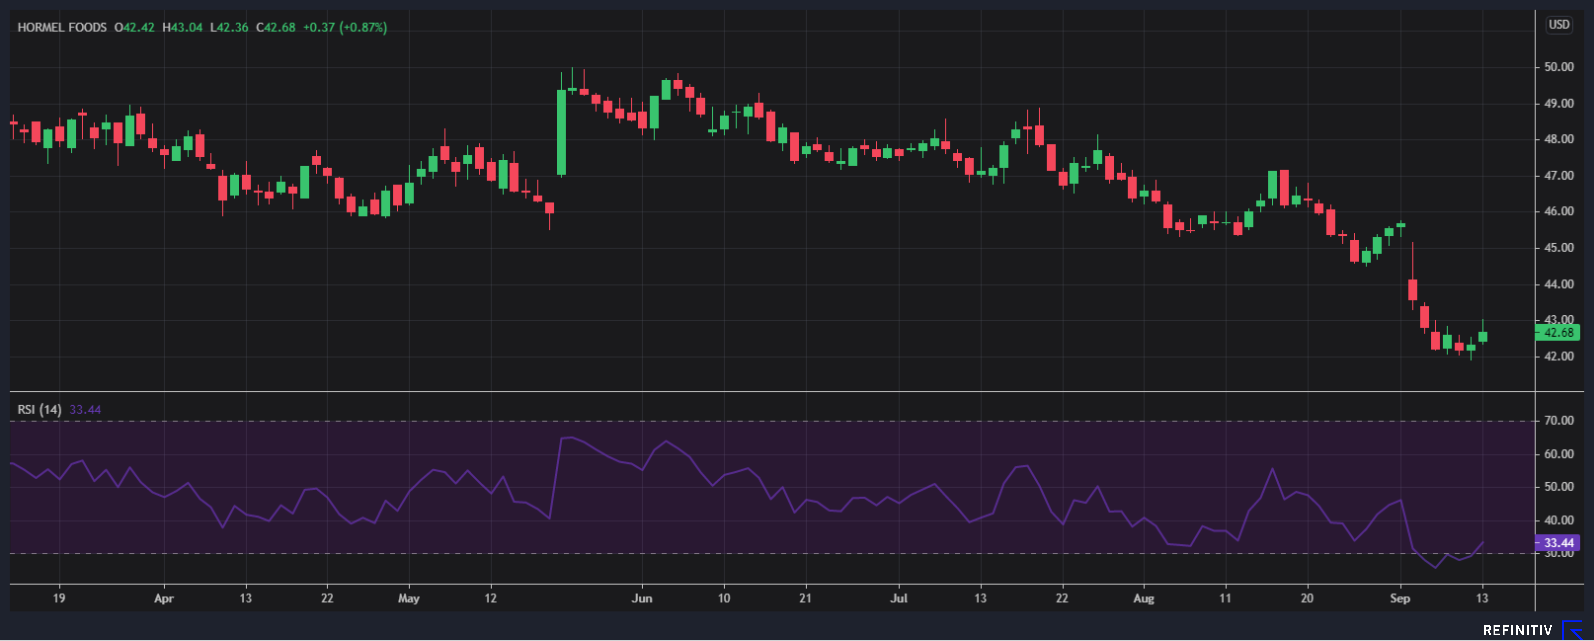
Source: REFINITIV
Note: Purple Color Line Reflects RSI (14-Period)
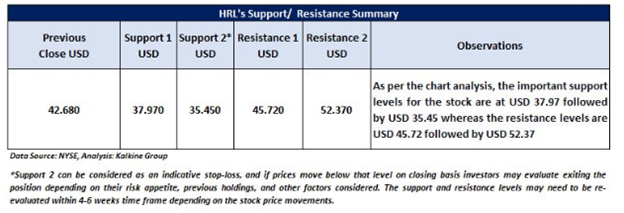
Stock Recommendation
The stock declined by ~11.8% in 6 months. It has made a 52-week low and high of $41.91 and $52.51, respectively.
The stock has been valued using an EV/Sales multiple-based illustrative relative valuation method and a target price which implies a rise of low double-digit (in percentage terms) has been arrived. The company might trade at a slight discount to its peers’ average, considering a lower ROIC at 1.8% in Q3FY21 versus 2.7% in Q3FY20, and an increase in debt to equity at 0.49x in Q3FY21 versus 0.21x in Q3FY20.
Considering the aforesaid facts, we give a “Buy” recommendation on the stock at the current market price of $42.68 per share, up by 0.87% as of 13th September 2021.
Note 1: The reference data in this report has been partly sourced from REFINITIV.
Note 2: Investment decisions should be made depending on the investors’ appetite on upside potential, risks, holding duration, and any previous holdings. Investors can consider exiting from the stock if the Target Price mentioned as per the analysis has been achieved and subject to the factors discussed above alongside support levels provided.
Technical Indicators Defined:-
Support: A level where-in the stock prices tend to find support if they are falling, and downtrend may take a pause backed by demand or buying interest.
Resistance: A level where-in the stock prices tend to find resistance when they are rising, and uptrend may take a pause due to profit booking or selling interest.
Stop-loss: It is a level to protect further losses in case of unfavourable movement in the stock prices.
Disclaimer
The advice given by Kalkine Canada Advisory Services Inc. and provided on this website is general information only and it does not take into account your investment objectives, financial situation and the particular needs of any particular person. You should therefore consider whether the advice is appropriate to your investment objectives, financial situation and needs before acting upon it. You should seek advice from a financial adviser, stockbroker or other professional (including taxation and legal advice) as necessary before acting on any advice. Not all investments are appropriate for all people. The website www.kalkine.ca is published by Kalkine Canada Advisory Services Inc. The link to our Terms & Conditions has been provided please go through them. On the date of publishing this report (mentioned on the website), employees and/or associates of Kalkine do not hold positions in any of the stocks covered on the website. These stocks can change any time and readers of the reports should not consider these stocks as advice or recommendations later.
 Please wait processing your request...