
Darling Ingredients Inc.

DAR Details
Darling Ingredients Inc. (NYSE: DAR) is a global developer and producer of natural ingredients from edible and inedible bio-nutrients for clients in the pharmaceutical, food, pet food, feed, industrial, fuel, bioenergy, and fertilizer industries.
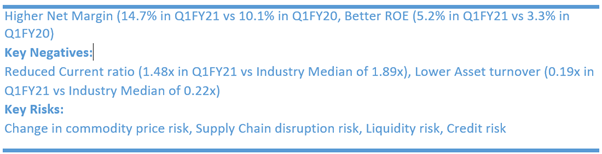
Key Positives:
Result Performance – For the First Quarter Ended 3 April 2021 – (Q1FY21)
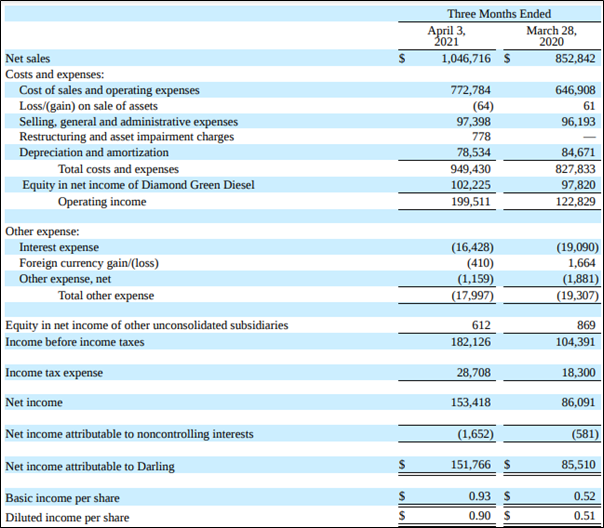
For the first quarter ended 3 April 2021, the net sales of the company reported at $1.05 billion, up 22.7% YoY, mainly on the back of positive contributions from across business segments. Their contributions in net sales growth stood in order of +39% YoY growth in Fuel, +27.1% YoY growth in Feed and +10.3% YoY growth in Food. Meanwhile, combined adjusted EBITDA stood at $284.8 million over $213.3 million in Q1FY20. Diamond Green Diesel (DGD) reported a record $2.77 EBITDA per gallon, contributing $108.2 million of EBITDA to Darling's fuel segment. Meanwhile, the net income attributable to the company was reported at $151.8 million, up 78.2% YOY.
Key Data (Source: Company Reports)
Recent Updates
On 25 May 2021, the company announced the appointment of Enderson Guimaraes to its Board of Directors and as a member of its Audit Committee.
Risk:
The company is exposed to the fluctuation in the prices of multiple products linked with commodities markets. In addition, the business is reliant on the sourcing and procuring of raw materials at favourable price to the company. Further, the DGD Joint Venture is dependent on governmental energy policies and programs.
Outlook:
Driven by the strong performance of the global ingredients business at the start of the year and a strong outlook for DGD, the company has increased the combined adjusted EBITDA guidance from $1.075 billion to $1.150 billion for FY21. This upwardly revised guidance range is 28%-35% stronger than FY20 performance reflects on the progress that the company is making on the path for global business growth and improved profitability into the future.
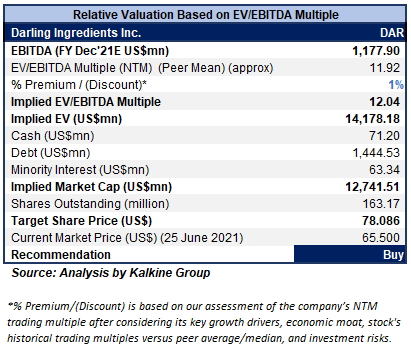
Valuation Methodology: EV/EBITDA Multiple Based Relative Valuation (Illustrative)
Technical Overview:
Weekly Chart –
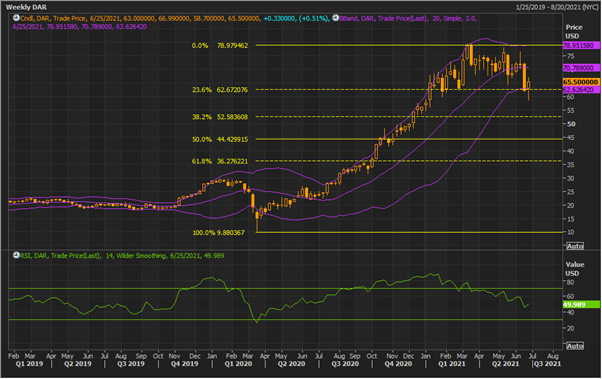
Source: REFINITIV
Note: Purple colour lines are Bollinger Bands® with the upper band suggesting overbought status while the lower band oversold status, and yellow lines are Fibonacci retracement lines which measure price rebound and backtrack. https://www.bollingerbands.com/
The stock witnessed a sharp fall in its prices in the previous week while remaining in underlying uptrend. However, on the first trading session of the ongoing week, the stock while remaining volatile, gave a stronger close $65.50 above the 23.6% retracement level. This shows resilience of the stock. The technical indicator RSI with a reading around 50 and a curve pointing up, suggests bullish momentum for the stock.
Going forward, the stock may have resistance around the converging point of the previous high and the upper Bollinger band of $79.85 whereas support could be around the 23.6% retracement level of $62.67.
Stock Recommendation:
Over the last six months, the stock was up by ~+15.9% while, over the last nine months, the stock was up by ~+93.4%, and in 1 year the stock increased by +181.7%. The stock is trading above the average price of the 52-week low-high range of $22.545-$79.65, respectively.
We have applied EV/EBITDA multiplebased relative valuation (on an illustrative basis) and the target price so arrived reflects a rise of low double-digit (in % terms). We have applied a slight premium to peer average EV/EBITDA multiple (NTM basis) considering improved Cash conversion cycle of 53.9 days in Q1FY21 versus 63.8 days in Q1FY20 and lower Debt to Equity versus peers.
Considering, the aforementioned factors along with its healthy liquidity position and growth strategy, we give a “Buy” recommendation on the stock at the current market price of $65.50 per share, up by 0.51% on 25th June 2021.
Note 1: The reference data in this report has been partly sourced from REFINITIV.
Note 2: Investment decisions should be made depending on the investors’ appetite on upside potential, risks, holding duration, and any previous holdings. Investors can consider exiting from the stock if the Target Price mentioned as per the analysis has been achieved and subject to the factors discussed above alongside support levels provided.
Technical Indicators Defined:-
Support: A level where-in the stock prices tend to find support if they are falling, and downtrend may take a pause backed by demand or buying interest.
Resistance: A level where-in the stock prices tend to find resistance when they are rising, and uptrend may take a pause due to profit booking or selling interest.
Disclaimer
The advice given by Kalkine Canada Advisory Services Inc. and provided on this website is general information only and it does not take into account your investment objectives, financial situation and the particular needs of any particular person. You should therefore consider whether the advice is appropriate to your investment objectives, financial situation and needs before acting upon it. You should seek advice from a financial adviser, stockbroker or other professional (including taxation and legal advice) as necessary before acting on any advice. Not all investments are appropriate for all people. The website www.kalkine.ca is published by Kalkine Canada Advisory Services Inc. The link to our Terms & Conditions has been provided please go through them. On the date of publishing this report (mentioned on the website), employees and/or associates of Kalkine do not hold positions in any of the stocks covered on the website. These stocks can change any time and readers of the reports should not consider these stocks as advice or recommendations later.
 Please wait processing your request...