
This report is an updated version of the report published on 17 September 2024 at 3:30 PM AEDT.
(Source: REFINITIV)
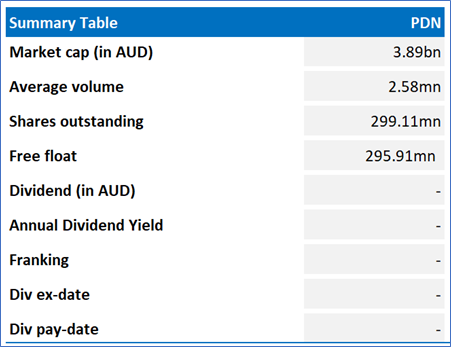
Paladin Energy Ltd (ASX: PDN)
is an Australia-based independent uranium producer with a 75% ownership of the world-class long-life Langer Heinrich Mine (LHM) located in Namibia. It also owns a portfolio of uranium exploration and development assets in Canada and Australia.
Recommendation Rationale – SELL at AUD 13.270
PDN's other income decreased to USD 2.34mn in FY24, compared to USD 4.70mn in FY23. Additionally, the company’s cash and cash equivalents declined to USD 48.86mn as of 30 June 2024, from USD 126.64mn as of 30 June 2023. Interest-bearing loans and borrowings increased to USD 132.34mn as of 30 June 2024, compared to USD 89.71mn as of 30 June 2023.
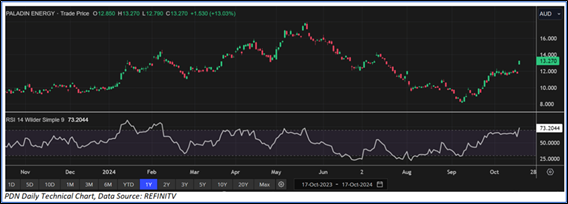
PDN’s Daily Price Chart
Valuation Methodology: Price/Earnings Approach (FY June'25E) (Illustrative)
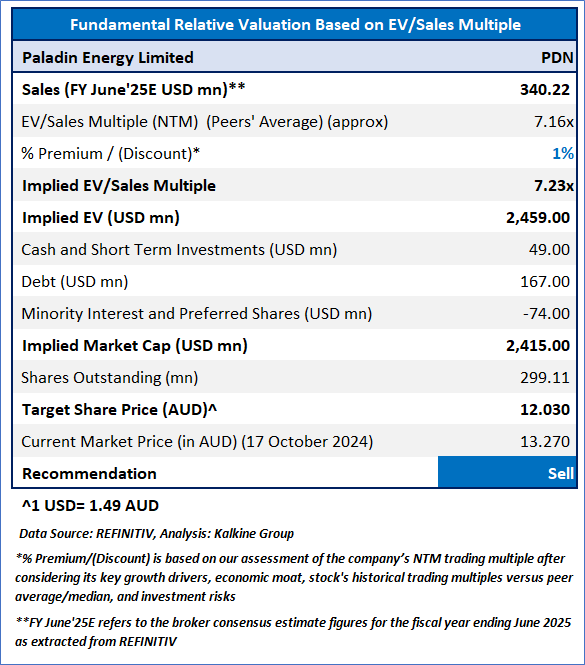
PDN is expected to trade at premium based on increased net income in FY24, production at LHM resumed, and expected global exploration and growth potential. For conducting the valuation, the following peers have been considered: Peninsula Energy Ltd (ASX: PEN), Santos Ltd (ASX: STO), Woodside Energy Group Ltd (ASX: WDS), and others have been considered.
Considering that the stock has surpassed its R2 level, market uncertainties, and risks associated, the share price can witness resistance at the current levels. Hence, a ‘Sell’ recommendation is given on the stock at the current market price of AUD 13.270, as of 17 October 2024, at 11:12 AM AEDT.
Markets are trading in a highly volatile zone currently due to certain macro-economic issues and geopolitical issues prevailing geopolitical tensions. Therefore, it is prudent to follow a cautious approach while investing.
Note 1: Past performance is neither an indicator nor a guarantee of future performance.
Note 2: The reference date for all price data, currency, technical indicators, support, and resistance levels is 17 October 2024. The reference data in this report has been partly sourced from REFINITIV.
Note 3: Investment decisions should be made depending on an individual's appetite for upside potential, risks, holding duration, and any previous holdings. An 'Exit' from the stock can be considered if the Target Price mentioned as per the Valuation and or the technical levels provided has been achieved and is subject to the factors discussed above.
Technical Indicators Defined: -
Support: A level at which the stock prices tend to find support if they are falling, and downtrend may take a pause backed by demand or buying interest.
Resistance: A level at which the stock prices tend to find resistance when they are rising, and uptrend may take a pause due to profit booking or selling interest.
Stop-loss: In general, it is a level to protect further losses in case of any unfavourable movement in the stock prices.
The advice given by Kalkine Canada Advisory Services Inc. and provided on this website is general information only and it does not take into account your investment objectives, financial situation and the particular needs of any particular person. You should therefore consider whether the advice is appropriate to your investment objectives, financial situation and needs before acting upon it. You should seek advice from a financial adviser, stockbroker or other professional (including taxation and legal advice) as necessary before acting on any advice. Not all investments are appropriate for all people. The website www.kalkine.ca is published by Kalkine Canada Advisory Services Inc. The link to our Terms & Conditions has been provided please go through them. On the date of publishing this report (mentioned on the website), employees and/or associates of Kalkine do not hold positions in any of the stocks covered on the website. These stocks can change any time and readers of the reports should not consider these stocks as advice or recommendations later.
 Please wait processing your request...