
Section1: Company Overview
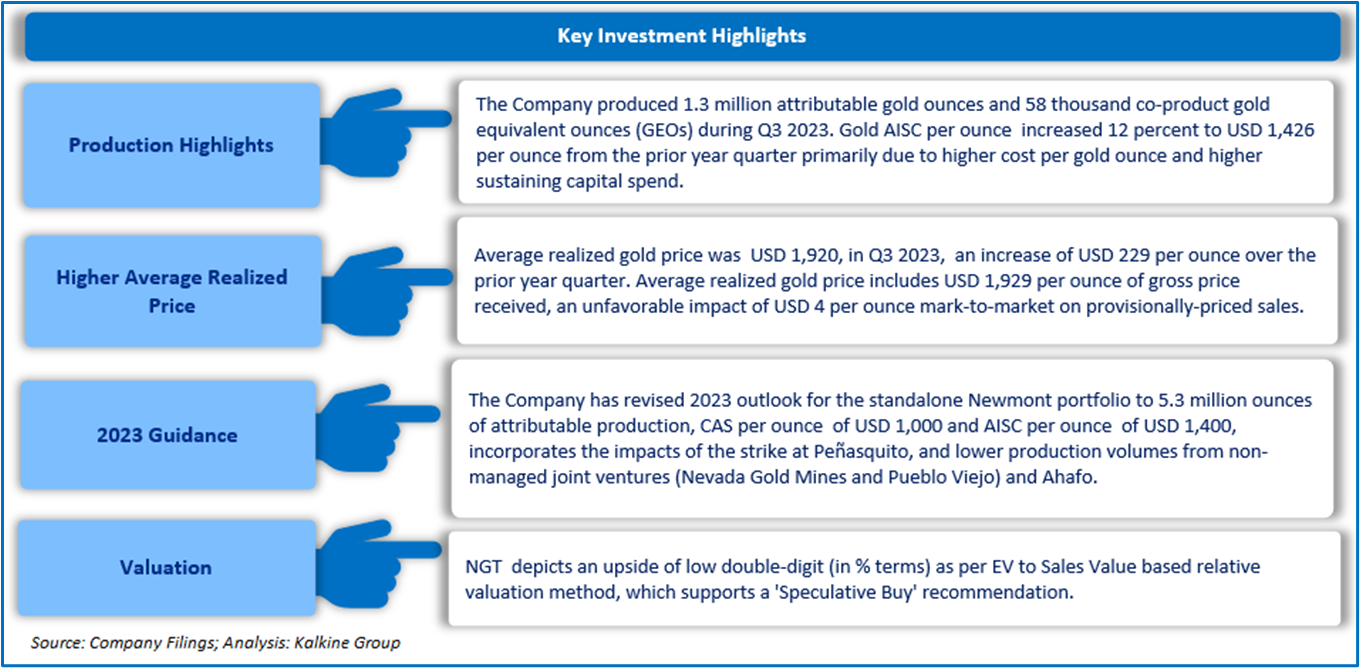
Newmont Corp (TSX: NGT) is primarily a gold producer with operations and/or assets in the United States, Canada, Mexico, Dominican Republic, Peru, Suriname, Argentina, Chile, Australia, and Ghana. It is also engaged in the production of copper, silver, lead and zinc. The company's operations are organized in five geographic regions: North America, South America, Australia, Africa and Nevada. This Report covers the Investment Highlights, Key Financial Metrics, Risks, Technical Analysis along with the Valuation, Target Price, and Recommendation on the stock.
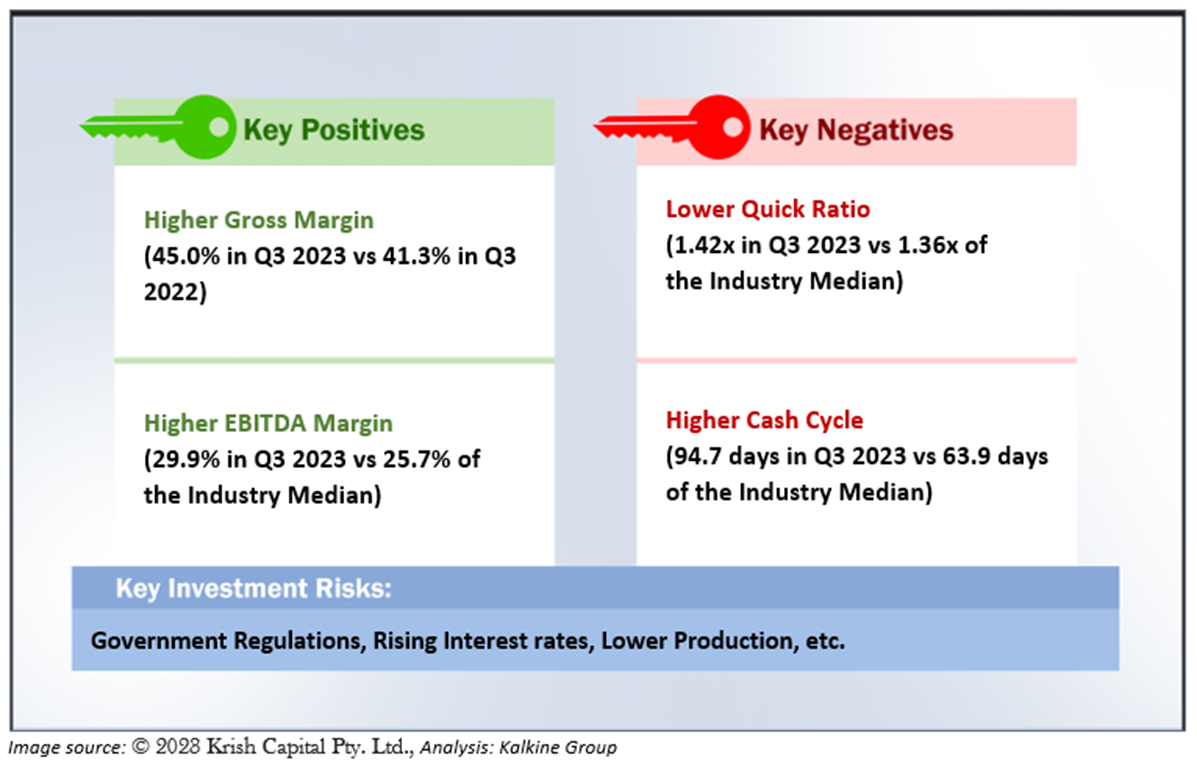
1.1 The Key Positives, Negatives, Investment Highlights, and Risks
Section2: Financial Highlights
2.1 Key Financial Highlights
Section 3: Stock Recommendation Summary
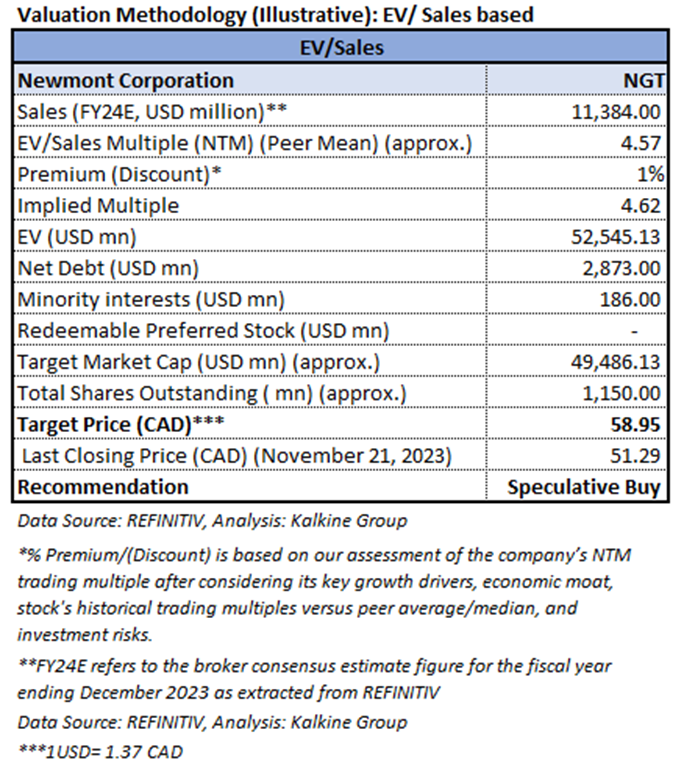
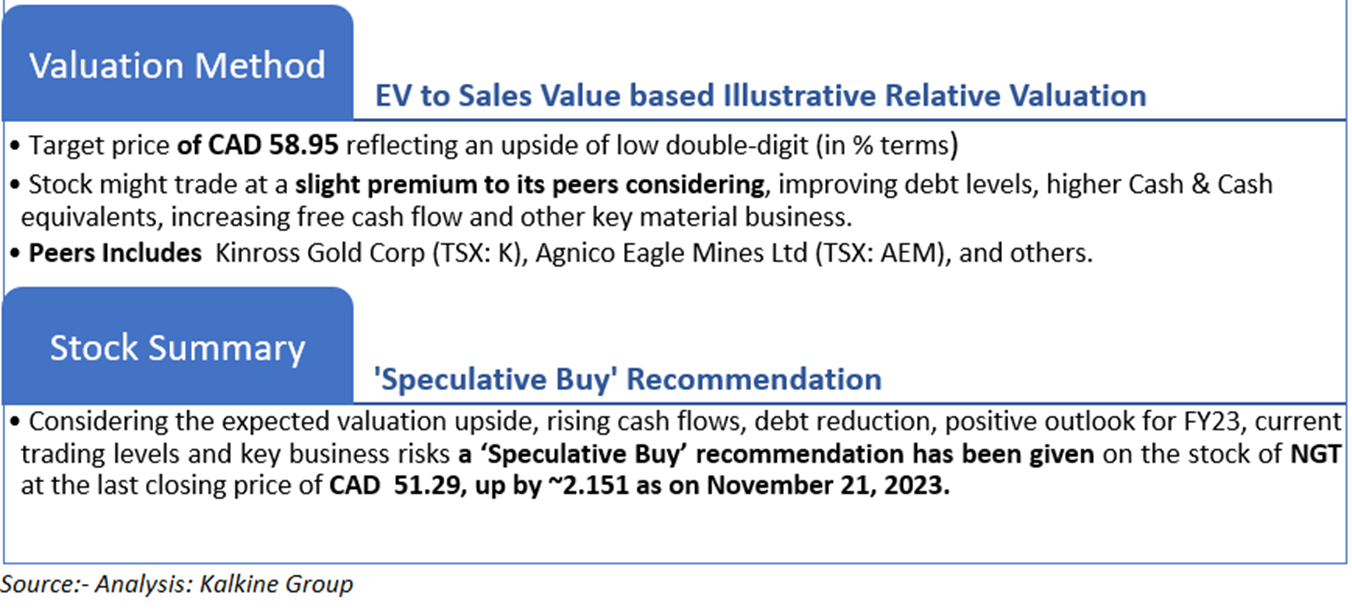
3.1 Valuation Methodology
Valuation Methodology (Illustrative): EV to Sales based
3.2 Price Performance and Stock Recommendation

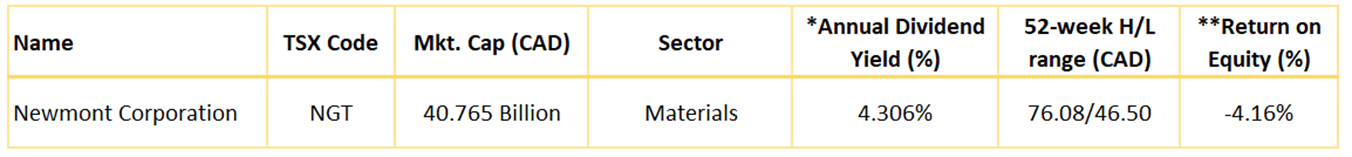
The stock has witnessed a downside of ~3.62% and ~2.06% over the last 1 month and 3 months respectively. Moreover, the stock is trading below the average of 52-week high price of CAD 76.08 and 52-week low price of CAD 46.50 providing an opportunity to ride the trend. Newmont Corporation (TSX: NGT) was last covered on 30th October 2023.
3.3 One-Year Technical Price Chart
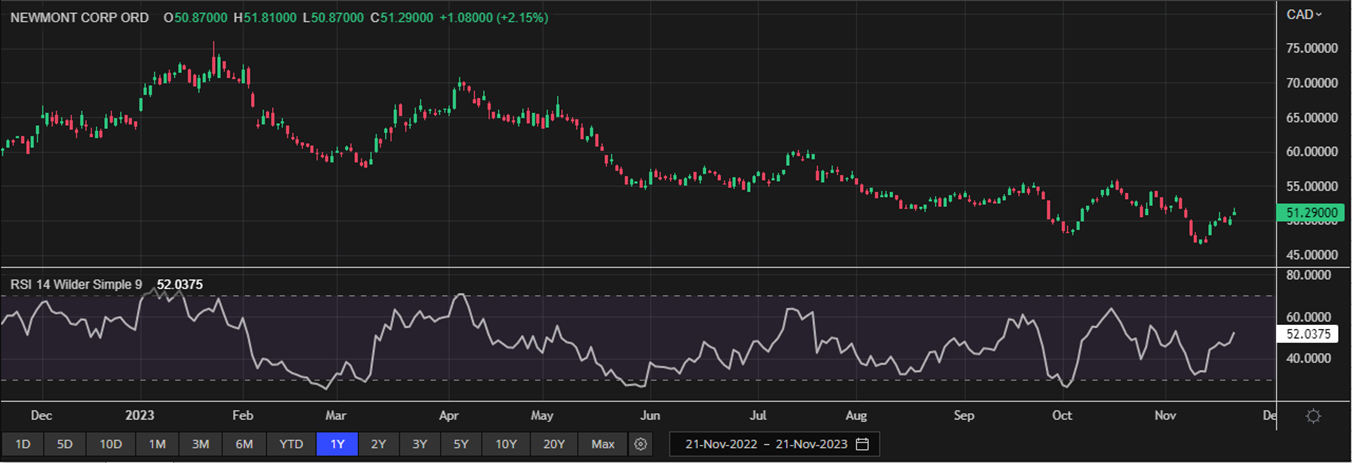
One-Year Technical Price Chart (as of November 21, 2023). Source: REFINITIV, Analysis: Kalkine Group
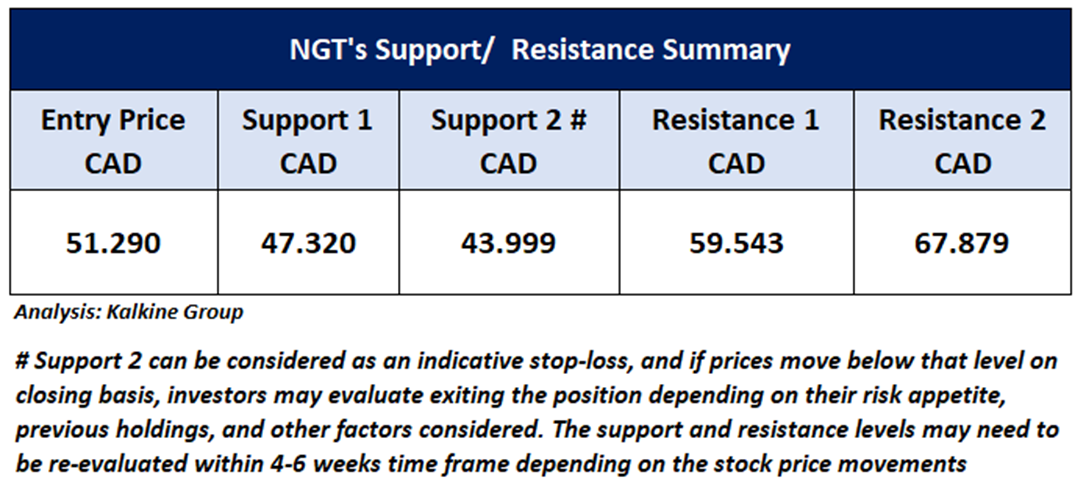
3.4 Technical Summary
Note 1: Past performance is not a reliable indicator of future performance.
Note 2: The reference date for all price data, currency, technical indicators, support, and resistance levels as on November 21, 2023. The reference data in this report has been partly sourced from REFINITIV.
Note 3: Investment decisions should be made depending on an individual's appetite for upside potential, risks, holding duration, and any previous holdings. An 'Exit' from the stock can be considered if the Target Price mentioned as per the Valuation and or the technical levels provided has been achieved and is subject to the factors discussed above.
Technical Indicators Defined: -
Support: A level at which the stock prices tend to find support if they are falling, and a downtrend may take a pause backed by demand or buying interest.
Resistance: A level at which the stock prices tend to find resistance when they are rising, and the uptrend may take a pause due to profit booking or selling interest.
Stop-loss: In general, it is a level to protect further losses in case of any unfavourable movement in the stock prices.

 Please wait processing your request...