
Semtech Corporation

SMTC Details
Semtech Corporation (NASDAQ: SMTC) provides analog as well as mixed-signal semiconductor products to original equipment manufacturers and distributors.
Financial Results
Outlook
For Q1 FY 2025, SMTC is expecting net sales of ~$200 Mn (+/- $5 Mn) and gross margin of 49.5% (+/- 100 bps). It is expecting operating income of $20.5 Mn (+/- $3.0 Mn).
Key Risks
The cyclical nature of the industry, Risks relating to production operations and services, etc. are some of the risks SMTC is exposed to.
Fundamental Valuation
EV/Sales Based Relative Valuation
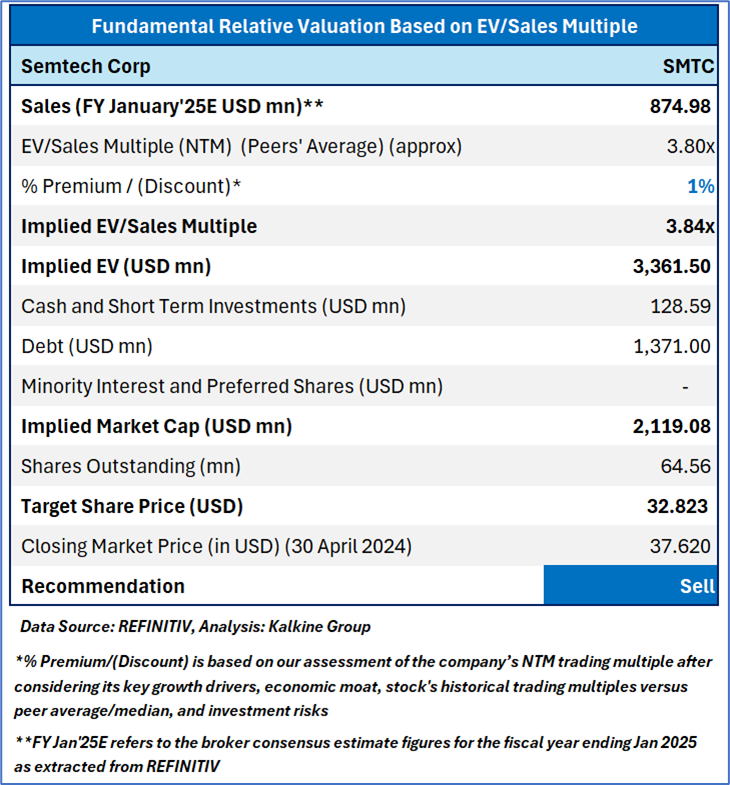
Stock Recommendation
Over the last one month, the stock has given a return of 36.4%. The stock has made a 52-week low and high of USD 37.08 and USD 13.13, respectively. The company’s performance is exposed to the risks related to the global slowdown as well as geopolitical tensions.
Also, unfavorable or uncertain conditions in the 5G infrastructure market could result in fluctuations in the rate of revenue growth or financial results. The company is subject to export restrictions as well as laws affecting trade and investments. This could limit the ability to sell to certain customers.
Hence, a ‘Sell’ rating has been provided on the stock at the closing price of $37.62 per share, up by 1.54% as on 30th April 2024
Technical Overview:
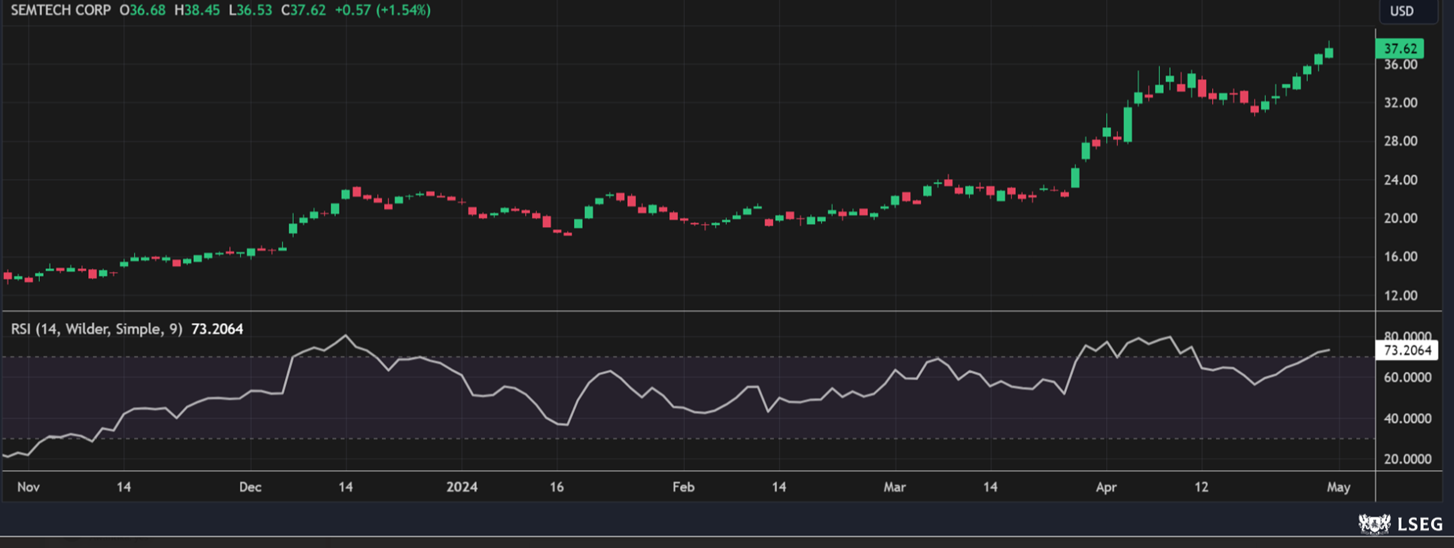
SMTC Daily Technical Chart, Data Source: REFINITIV
Markets are trading in a highly volatile zone currently due to certain macro-economic and geopolitical tensions prevailing. Therefore, it is prudent to follow a cautious approach while investing.
Note 1: Past performance is neither an indicator nor a guarantee of future performance.
Note 2: The reference date for share price chart and stock valuation is based on April 30, 2024. The reference data in this report has been partly sourced from REFINITIV.
Note 3: Investment decisions should be made depending on an individual's appetite for upside potential, risks, holding duration, and any previous holdings. An 'Exit' from the stock can be considered if the Target Price mentioned as per the Valuation and or the technical levels provided has been achieved and is subject to the factors discussed above.
The advice given by Kalkine Canada Advisory Services Inc. and provided on this website is general information only and it does not take into account your investment objectives, financial situation and the particular needs of any particular person. You should therefore consider whether the advice is appropriate to your investment objectives, financial situation and needs before acting upon it. You should seek advice from a financial adviser, stockbroker or other professional (including taxation and legal advice) as necessary before acting on any advice. Not all investments are appropriate for all people. The website www.kalkine.ca is published by Kalkine Canada Advisory Services Inc. The link to our Terms & Conditions has been provided please go through them. On the date of publishing this report (mentioned on the website), employees and/or associates of Kalkine do not hold positions in any of the stocks covered on the website. These stocks can change any time and readers of the reports should not consider these stocks as advice or recommendations later.
 Please wait processing your request...