
SolarEdge Technologies, Inc.
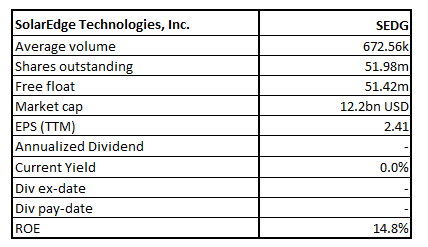
SEDG Details
SolarEdge Technologies, Inc. (NASDAQ: SEDG) is a top global player in smart energy technology. It caters to the requirements of various energy market segments through its offerings such as through its PV, storage, EV charging, batteries, UPS, electric vehicle powertrains, and grid services solutions. The company has a market capitalization of ~$12.2 billion as on 9th June 2021.
Result Performance (For the Year Ended 31 December 2020)
The company reported 2% YoY increase in its revenue for full year FY20 to $1.46 billion. Record revenue of $1.36 billion was generated from solar products in FY20. However, an increase in operating expenses by 10.2% YoY led to a decline in operating income by 25% YoY to $142.6 million in GAAP terms. The decline in operating income coupled with an increase in income taxes led to a decline in net income by 3.2% YoY to $140.3 million.
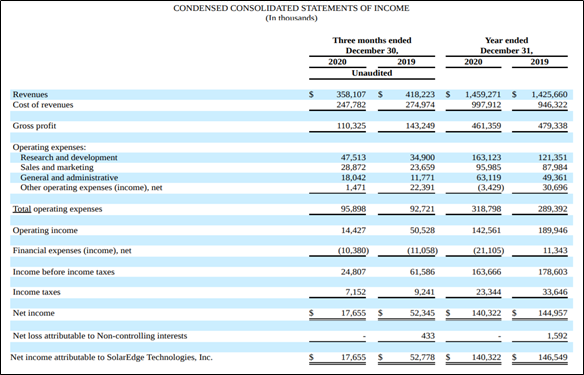
Consolidated Condenses Income Statement (Source: Company Reports)
Q1FY21 Results Performance (For the Quarter Ended March 31, 2021)
SEDG has recorded a 13% QoQ growth in revenues to $405.5 million as against $358.1 million in the prior quarter but it declined by 6% YoY on the same quarter last year. Revenue from the sale of solar products increased by 15% to $376.4 million on QoQ but decreased by 8% YoY on the same quarter last year. GAAP operating expenses was flat at $95.9 million on QoQ but up 33% YoY on the same quarter last year. GAAP operating income increased by 206% to $44.1 million on QoQ but declined by 35% YoY on the same quarter previous year. GAAP net income increased 70% QoQ to $30.1 million but decreased by 29% YoY on the same quarter last year.
Outlook:
SEDG has provided guidance for Q2FY21 whereby it expects revenues in Q2FY21 to stay in between $445 million to $465 million with revenues from solar products to remain in the range of $405 million to $420 million. Further, it has also provided guidance on the gross margin in non-GAAP terms to be in the range of 32% to 34%. Non-GAAP gross margin from solar products is expected to be within the range of 36% to 38%. Thus, the company is optimistic about improved performance on the back of improved business sentiment post lifting of restrictions and rapid recovery in the economy being witnessed.
Key Risk:
The company is exposed to the risk of the rapidly evolving and competitive nature of the solar industry which might cause sustained pressure on gross margin.
Technical Overview:
Weekly Chart –
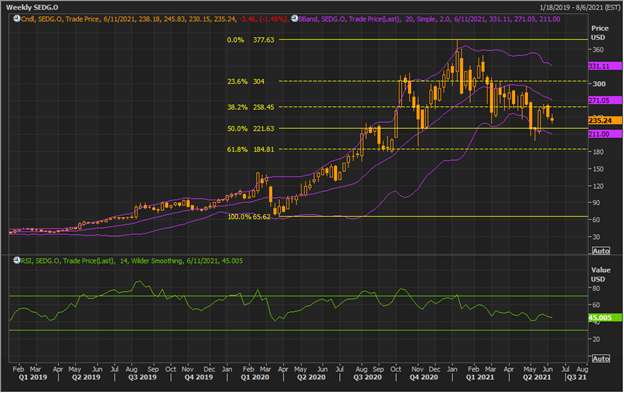
Source: REFINITIV
Note: Purple colour lines are Bollinger Bands® with the upper band suggesting overbought status while the lower band oversold status, and yellow lines are Fibonacci retracement lines which measure price rebound and backtrack. https://www.bollingerbands.com/
The stock has been experiencing irregular movement in its prices with bias on the downside. For the ongoing week, it has given a close $235.24 which is still above the crucial 50% retracement level of $221.63 thereby exhibiting confirming uptrend for the stock. The technical indicator RSI with a reading around 45 suggests neutral to positive momentum for the stock.
Going forward, the stock may have resistance around 20 periods SMA of $271.05 whereas support could be around the 50% retracement level of $221.63.
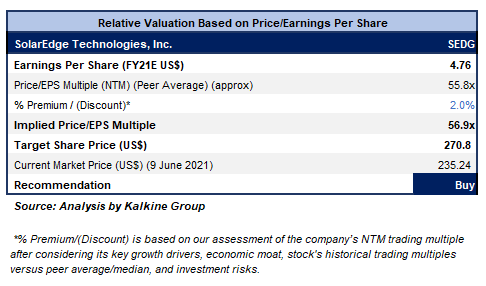
Valuation Methodology: Price/Earnings Per Share Multiple Based Relative Valuation (Illustrative)
Stock Recommendation:
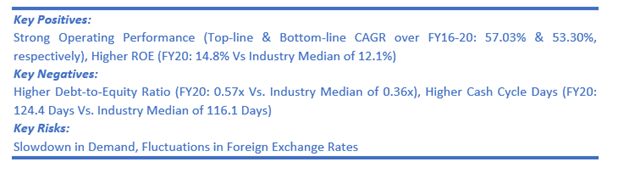
The company’s ROE for FY20 stood at 14.8%, better than the industry median of 12.1%, implying that the company generated better returns for the shareholders than the peer group. Its current ratio for FY20 stood at 3.94x, better than the industry median of 3.18x, implying a strong liquidity position of the company.
We have valued the stock using a P/E multiple-based illustrative relative valuation and have arrived at a target price which reflects a rise of low double-digit (in % terms). We believe the company can trade at a slight premium to its P/E Multiple (NTM) (Peer Average) considering higher ROE and decent outlook.
Considering the aforesaid facts and current trading levels, we give a “Buy” recommendation at the current market price of US$235.24 per share, down by 1.45% on 9th June 2021.
Technical Indicators Defined:
Support: A level where-in the stock prices tend to find support if they are falling, and downtrend may take a pause backed by demand or buying interest.
Resistance: A level where-in the stock prices tend to find resistance when they are rising, and uptrend may take a pause due to profit booking or selling interest.
Stop-loss: It is a level to protect further losses in case of unfavourable movement in the stock prices.
Note 1: The reference data in this report has been partly sourced from REFINITIV
Note 2: Investment decisions should be made depending on the investors’ appetite on upside potential, risks, holding duration, and any previous holdings. Investors can consider exiting from the stock if the Target Price mentioned as per the analysis has been achieved and subject to the factors discussed above alongside support levels provided.
Disclaimer
The advice given by Kalkine Canada Advisory Services Inc. and provided on this website is general information only and it does not take into account your investment objectives, financial situation and the particular needs of any particular person. You should therefore consider whether the advice is appropriate to your investment objectives, financial situation and needs before acting upon it. You should seek advice from a financial adviser, stockbroker or other professional (including taxation and legal advice) as necessary before acting on any advice. Not all investments are appropriate for all people. The website www.kalkine.ca is published by Kalkine Canada Advisory Services Inc. The link to our Terms & Conditions has been provided please go through them. On the date of publishing this report (mentioned on the website), employees and/or associates of Kalkine do not hold positions in any of the stocks covered on the website. These stocks can change any time and readers of the reports should not consider these stocks as advice or recommendations later.
 Please wait processing your request...