

Section1: Company Overview
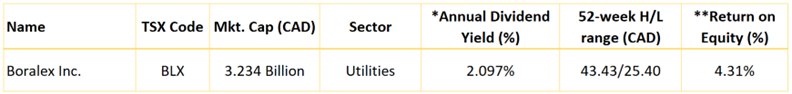
Boralex Inc (TSX: BLX) is an electric utility company involved in the development, construction, and operation of renewable energy power facilities. The company controls a portfolio of electricity producing plants that utilize wind, hydroelectric, thermal, and solar fuel sources. Most of Boralex's plants rely on wind power, while a significant number also employ hydroelectric power. The company generates majority of its revenue from the sale of energy through long-term contracts to customers in Canada, France, and the United States. Boralex's wind and hydroelectric power stations, located in Canada and France, account for most of this revenue. This Report covers the Investment Highlights, Key Financial Metrics, Risks, Technical Analysis along with the Valuation, Target Price, and Recommendation on the stock.
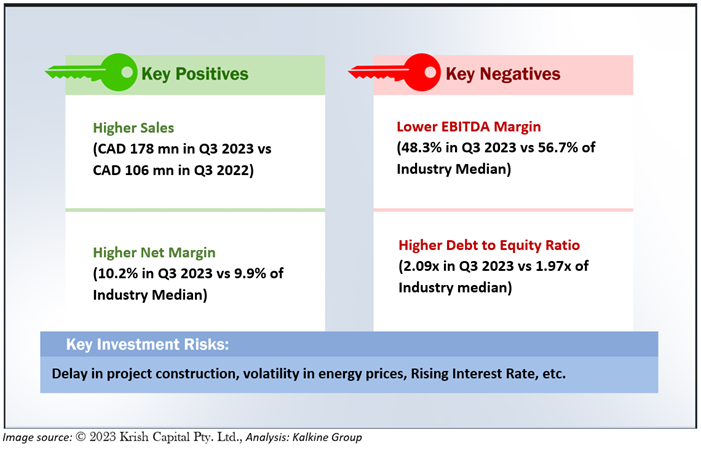
1.1 The Key Positives, Negatives, Investment Highlights, and Risks
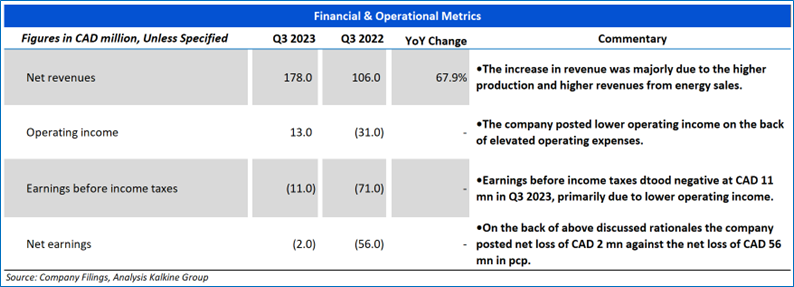
Section2: Financial Highlights
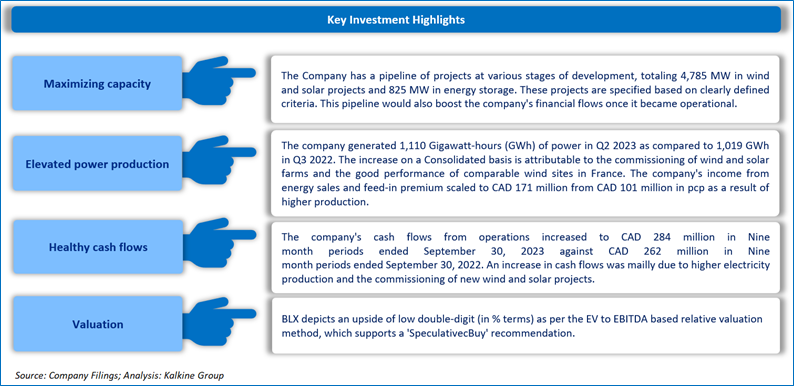
2.1 Key Financial Highlights
Section 3: Stock Recommendation Summary
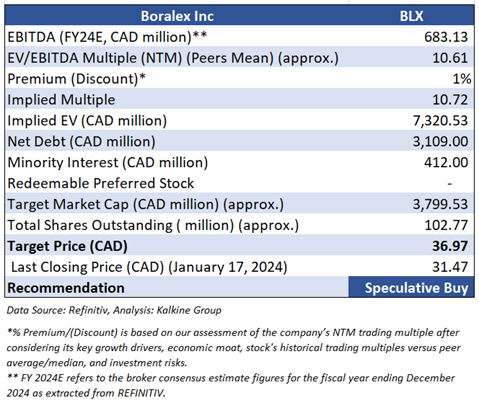
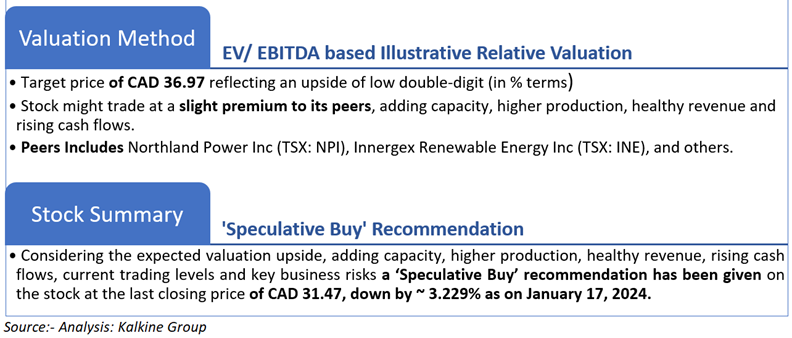
3.1 Valuation Methodology EV to EBITDA Based
3.2 Price Performance and Stock Recommendation

The stock has witnessed a downside of ~6.67% in 1 week and ~6.36% over the last 1 month. The stock has a 52-week high and 52-week low of CAD 43.43 and CAD 25.40 respectively and is currently trading below the average of 52-week high-low average providing an opportunity to accumulate the stock. Boralex Inc (TSX: BLX) was last covered on November 30, 2023.
3.3 One-Year Technical Price Chart
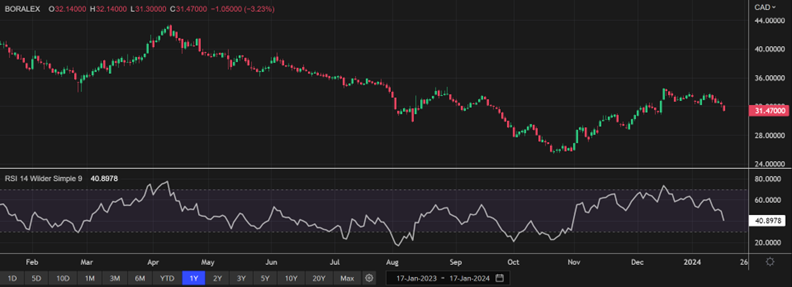
One-Year Technical Price Chart (as of January 17, 2024). Source: REFINITIV, Analysis: Kalkine Group
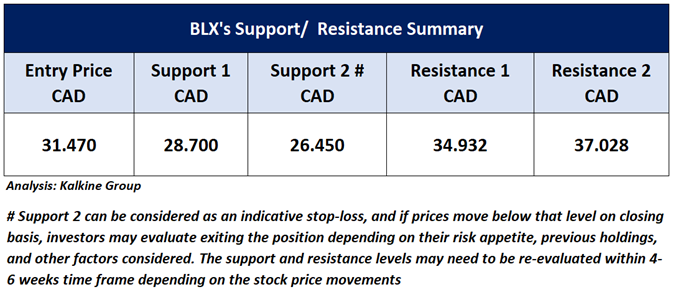
3.4 Technical Summary
Note 1: Past performance is not a reliable indicator of future performance.
Note 2: The reference date for all price data, currency, technical indicators, support, and resistance levels is January 17, 2024. The reference data in this report has been partly sourced from REFINITIV.
Note 3: Investment decisions should be made depending on an individual's appetite for upside potential, risks, holding duration, and any previous holdings. An 'Exit' from the stock can be considered if the Target Price mentioned as per the Valuation and or the technical levels provided has been achieved and is subject to the factors discussed above.
Note 4: Dividend Yield may vary as per the stock price movement.
Technical Indicators Defined: -
Support: A level at which the stock prices tend to find support if they are falling, and a downtrend may take a pause backed by demand or buying interest. Support 1 refers to the nearby support level for the stock and if the price breaches the level, then Support 2 may act as the crucial support level for the stock.
Resistance: A level at which the stock prices tend to find resistance when they are rising, and an uptrend may take a pause due to profit booking or selling interest. Resistance 1 refers to the nearby resistance level for the stock and if the price surpasses the level, then Resistance 2 may act as the crucial resistance level for the stock.
Stop-loss: It is a level to protect further losses in case of unfavourable movement in the stock prices.
The advice given by Kalkine Canada Advisory Services Inc. and provided on this website is general information only and it does not take into account your investment objectives, financial situation and the particular needs of any particular person. You should therefore consider whether the advice is appropriate to your investment objectives, financial situation and needs before acting upon it. You should seek advice from a financial adviser, stockbroker or other professional (including taxation and legal advice) as necessary before acting on any advice. Not all investments are appropriate for all people. The website www.kalkine.ca is published by Kalkine Canada Advisory Services Inc. The link to our Terms & Conditions has been provided please go through them. On the date of publishing this report (mentioned on the website), employees and/or associates of Kalkine do not hold positions in any of the stocks covered on the website. These stocks can change any time and readers of the reports should not consider these stocks as advice or recommendations later.
 Please wait processing your request...