
Hormel Foods Corporation
HRL Details
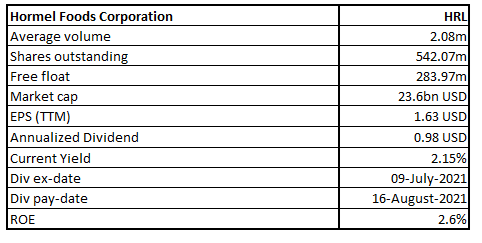
Hormel Foods Corporation (NYSE: HRL) is a global top branded food company with prominent brands comprising of Skippy®, SPAM®, Hormel® Natural Choice®, Columbus®, Applegate®, Justin's®, Wholly®, Hormel® Black Label®, among others.
Q2FY21 Result Performance (For the Period Ended 25 April 2021)
Consolidated Financial Snapshot (Source: Company Reports)
Launched Plant-Based Pepperoni Style Topping
The company, on 17 August 2021, introduced Happy Little Plants® pepperoni style topping. It has developed this plant-based pepperoni style topping by closely working with pizzerias, chefs, foodservice operators, and pizza experts that cook and taste similar to that of traditional pepperoni.
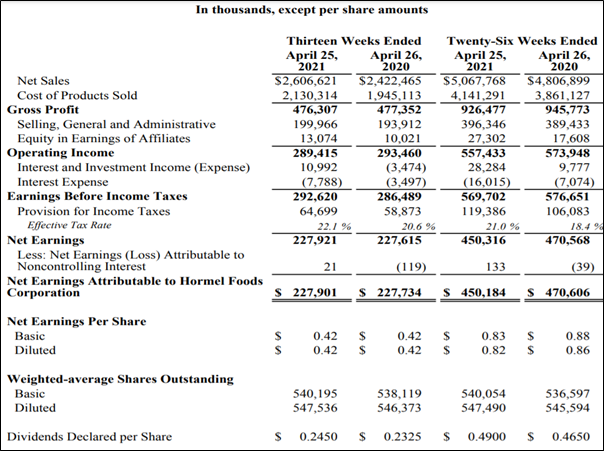
Third Quarter Results
Outlook
The company is expecting to post record sales again in Q4 FY 2021, along with the improving margins as and when additional pricing actions come into effect. In fiscal 2021, the net sales is expected to be between $11.0 Bn - $11.2 Bn and diluted EPS is expected in the range of $1.65 - $1.69. Notably, the fiscal 2021 outlook includes the acquisition of the Planters® snack nuts business.
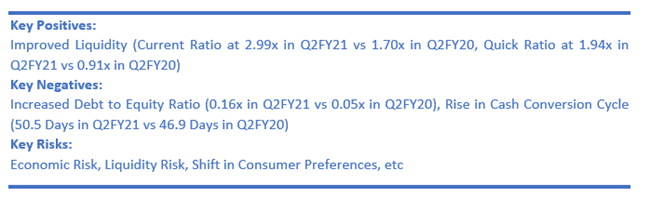
Key Risks
The company is exposed to the risk of changes in national or global economic conditions that could severely hit its business. Further, the company is susceptible to the risk of reduction in consumer spending rates as well as shifts in consumer product preferences.
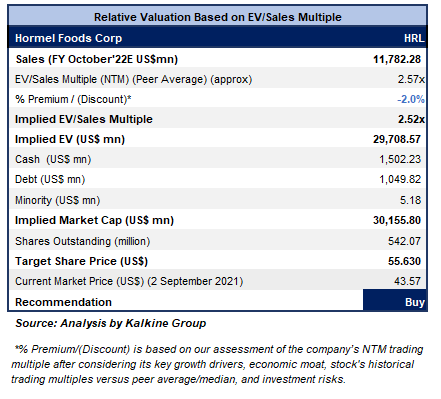
Valuation Methodology: EV/Sales Based Relative Valuation (Illustrative)
Technical Overview:
Chart:
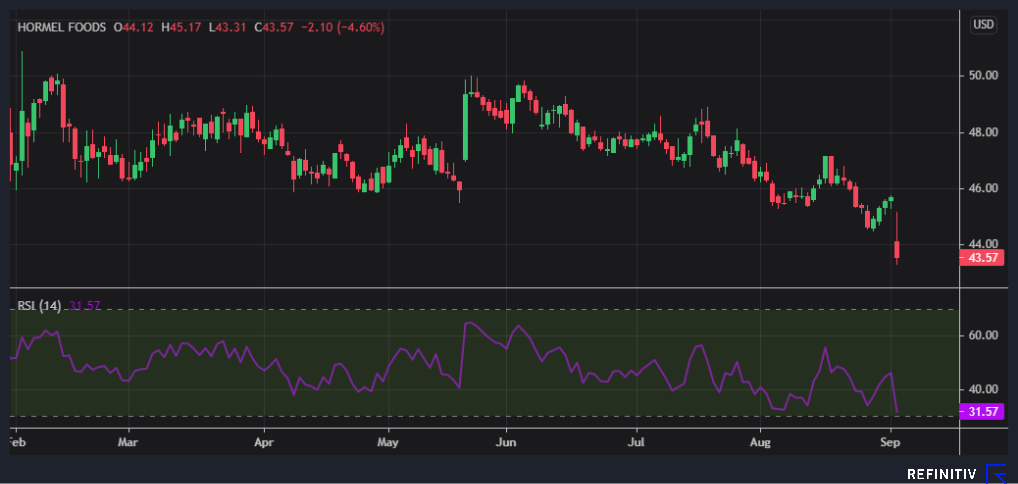
Source: REFINITIV
Note: Purple Color Line Reflects RSI (14-Period)
Stock Recommendation
The stock has been valued using EV/Sales multiple based relative valuation (on an illustrative basis) and the target price so arrived reflects the potential rise of low double-digit (in % terms). A slight discount has been applied to EV/Sales Multiple (NTM) (Peer Average), considering the risks related to the business as well as fall in the operating income in Q3 FY 2021 on the YoY basis.
For the purposes of relative valuation, peers like General Mills Inc (GIS.N), Alico Inc (ALCO.OQ), among others have been considered.
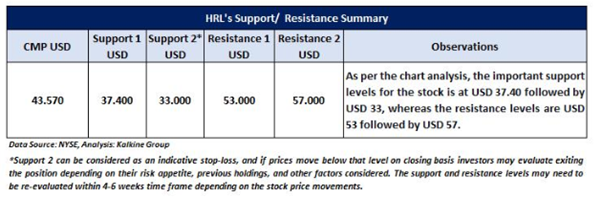
Considering the aforementioned factors, we give a “Buy” recommendation on the stock at the current market price of $43.57 per share, down by 4.6% on 2nd September 2021.
Note 1: The reference data in this report has been partly sourced from REFINITIV.
Note 2: Investment decisions should be made depending on the investors’ appetite on upside potential, risks, holding duration, and any previous holdings. Investors can consider exiting from the stock if the Target Price mentioned as per the analysis has been achieved and subject to the factors discussed above alongside support levels provided.
Technical Indicators Defined: -
Support: A level where-in the stock prices tend to find support if they are falling, and downtrend may take a pause backed by demand or buying interest.
Resistance: A level where-in the stock prices tend to find resistance when they are rising, and uptrend may take a pause due to profit booking or selling interest.
Stop-loss: It is a level to protect further losses in case of unfavourable movement in the stock prices.
Disclaimer
The advice given by Kalkine Canada Advisory Services Inc. and provided on this website is general information only and it does not take into account your investment objectives, financial situation and the particular needs of any particular person. You should therefore consider whether the advice is appropriate to your investment objectives, financial situation and needs before acting upon it. You should seek advice from a financial adviser, stockbroker or other professional (including taxation and legal advice) as necessary before acting on any advice. Not all investments are appropriate for all people. The website www.kalkine.ca is published by Kalkine Canada Advisory Services Inc. The link to our Terms & Conditions has been provided please go through them. On the date of publishing this report (mentioned on the website), employees and/or associates of Kalkine do not hold positions in any of the stocks covered on the website. These stocks can change any time and readers of the reports should not consider these stocks as advice or recommendations later.
 Please wait processing your request...