RY 159.49 -0.8825% SHOP 113.11 -2.5166% TD 83.83 -0.1786% ENB 62.4 -0.6686% BN 66.33 -3.6041% TRI 249.82 -0.8178% CNQ 39.49 -0.9779% CP 100.98 -2.1132% CNR 136.05 -0.9176% BMO 127.43 -1.4615% BNS 65.37 -0.4871% CSU 4581.3999 -2.1599% CM 80.6 -1.2255% MFC 39.09 -1.4124% ATD 71.82 0.7293% NGT 75.45 -1.0102% TRP 67.37 -1.5922% SU 47.64 -0.3347% WCN 269.98 -1.2365% L 214.79 0.5195%

mid-cap

Watch Out for One NYSE- Listed Software ADR– Full Truck Alliance Co Ltd

Aug 20, 2024 | Team Kalkine
Watch Out for One NYSE- Listed Software ADR– Full Truck Alliance Co Ltd

YMM:NYSE
Investment Type
Mid - Cap
Risk Level
Action
Rec. Price (US$)

Full Truck Alliance Co Ltd

Full Truck Alliance Co Ltd (NYSE: YMM) is a freight dispatch platform mainly engaged in the development of cloud computing, big data, mobile Internet and artificial intelligence technology. The Company’s main services include freight listing services, it can help shippers issue invoices and help truck drivers find goods in a standardized way through a mobile application; freight brokerage services, providing end-to-end freight matching services, to provide a higher level of service quality assurance; and online trading services.

Key Business & Financial Updates

  • Full Truck Alliance to Announce Q2 2024 Financial Results: Full Truck Alliance Co. Ltd. (NYSE: YMM) has announced that it will release its unaudited financial results for the second quarter of 2024 on Wednesday, August 21, 2024, prior to the U.S. market opening. The company's management will also hold an earnings conference call at 8:00 A.M. U.S. Eastern Time (8:00 P.M. Beijing Time) on the same day to discuss the results.
  • First Quarter 2024 Financial Performance: In the first quarter of 2024, the company reported total net revenues of RMB2,268.7 million (USD314.2 million), marking a 33.3% increase from RMB1,702.3 million in the same period of 2023. Net income for the quarter rose by 42.5%, reaching RMB586.4 million (USD81.2 million), compared to RMB411.4 million in the previous year. Non-GAAP adjusted net income amounted to RMB756.4 million (USD104.8 million), an increase of 46.9% from RMB514.8 million in 2023. Fulfilled orders increased by 29.6%, reaching 39.3 million, while the average shipper monthly active users (MAUs) increased by 22.3% to 2.14 million. The company's strong financial growth reflects its focus on optimizing its platform and enhancing order matching efficiency.
  • Operational Developments and Strategic Focus: The company's leadership emphasized its continued efforts to leverage technological innovations and enhance user acquisition strategies to drive growth. According to CEO Peter Hui Zhang, the company has strengthened its digital transformation initiatives, leading to improved customer engagement and higher order volumes from direct shippers. CFO Simon Cai highlighted that the impressive financial results, which exceeded expectations, are a testament to the company’s robust performance. The extension of the share repurchase program and the first-time declaration of a cash dividend further underline management’s confidence in the company's long-term growth and shareholder value.
  • Breakdown of Revenue Sources: Total net revenues in Q1 2024 saw a significant increase, primarily driven by growth in freight matching services, which generated RMB1,869.7 million (USD258.9 million), representing a 33.5% increase from the same period in 2023. Revenues from freight brokerage services increased by 24.9% to RMB965.2 million (USD133.7 million), while freight listing services grew by 6.7%, reaching RMB213.5 million (USD29.6 million). Transaction services contributed RMB691.0 million (USD95.7 million), reflecting a 61.5% rise in transaction volume and fee rates. Value-added services, including credit solutions, also grew by 32.3% to RMB399.0 million (USD55.3 million).
  • Cost and Expenses: The cost of revenues in Q1 2024 amounted to RMB1,031.9 million (USD142.9 million), up from RMB849.4 million in Q1 2023. This rise was primarily attributed to increases in VAT and related tax costs. Sales and marketing expenses increased by 38.4% to RMB340.1 million (USD47.1 million) due to higher advertising expenses and staff costs. General and administrative expenses also rose by 47.4%, reaching RMB264.5 million (USD36.6 million), driven by increased share-based compensation. Research and development costs grew moderately to RMB247.7 million (USD34.3 million).
  • Income and Profitability Metrics: Income from operations rose by 88.3% to RMB312.2 million (USD43.2 million) in Q1 2024, while non-GAAP adjusted operating income grew by 78.2% to RMB485.4 million (USD67.2 million). The company's strong financial performance led to a significant improvement in net income and profitability, with basic and diluted net income per ADS increasing to RMB0.56 (USD0.08). Non-GAAP adjusted basic and diluted net income per ADS stood at RMB0.72 (USD0.10).
  • Balance Sheet and Share Repurchase Program: As of March 31, 2024, the company maintained a robust cash position, with total cash equivalents, short-term investments, and other liquid assets amounting to RMB27.5 billion (USD3.8 billion). The outstanding balance of on-balance sheet loans was RMB3,565.2 million (USD493.8 million), with a slight increase in the non-performing loan ratio to 2.1%. The Board of Directors extended the share repurchase program, allowing the company to repurchase up to USD300 million of its ADSs through March 2025.
  • Business Outlook and Executive Changes: Looking ahead to the second quarter of 2024, the company expects total net revenues to range between RMB2.65 billion and RMB2.72 billion, reflecting anticipated year-over-year growth of 28.3% to 31.7%. These projections are based on current market conditions and business operations. Additionally, the company announced a change in its executive structure, with Mr. Zhenghong Wang stepping down as Chief Customer Officer as part of the company's organizational optimization.

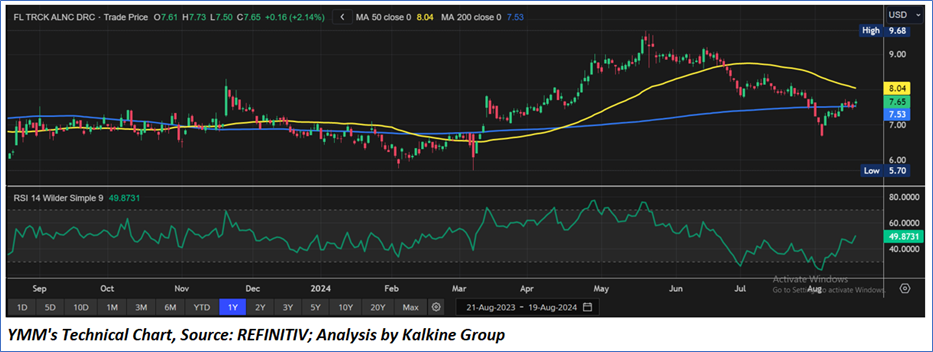
Technical Observation (on the daily chart):

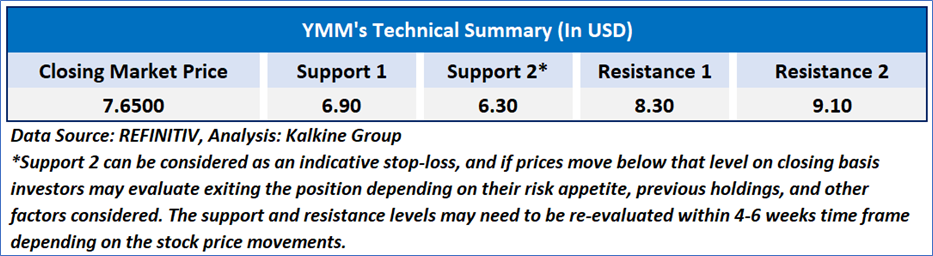
The Relative Strength Index (RSI) over a 14-day period stands at a value of 49.87, recovering from oversold zone, with the expectations of price taking support from the support zone of USD 7.00 – USD 7.50. A break below USD 7 level can lead the stock price to next important support of around USD 6.00 levels. Additionally, the stock's current positioning is between both 50-Day SMA and 200-Day SMA, which can act as a short to medium term resistance and support levels respectively.

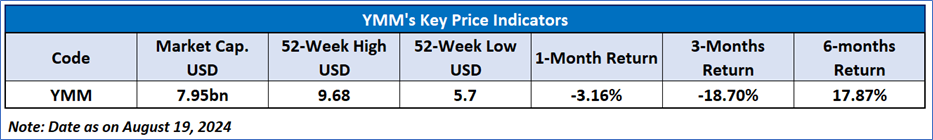
As per the above-mentioned price action, momentum in the stock over the last month, current macroeconomic scenarios, recent business & financial updates, and technical indicators analysis, a ‘WATCH’ rating has been given to Full Truck Alliance Co Ltd (NYSE: YMM) at the closing market price of USD 7.65 as of August 19, 2024. 

Individuals can evaluate the stock based on the support and resistance levels provided in the report in case of keen interest taking into consideration the risk-reward scenario. 

Markets are trading in a highly volatile zone currently due to certain macro-economic issues and prevailing geopolitical tensions. Therefore, it is prudent to follow a cautious approach while investing.

Related Risk: This report may be looked at from a high-risk perspective and a recommendation is provided for a short duration. This report is solely based on technical parameters, and the fundamental performance of the stocks has not been considered in the decision-making process. Other factors which could impact the stock prices include market risks, regulatory risks, interest rates risks, currency risks, social and political instability risks etc.

Note 1: Past performance is not a reliable indicator of future performance.

Note 2: The reference date for all price data, currency, technical indicators, support, and resistance level is August 19, 2024. The reference data in this report has been partly sourced from REFINITIV.

Note 3: Investment decisions should be made depending on an individual's appetite for upside potential, risks, holding duration, and any previous holdings. An 'Exit' from the stock can be considered if the Target Price mentioned as per the Valuation and or the technical levels provided has been achieved and is subject to the factors discussed above.

Note 4: Target Price refers to a price level that the stock is expected to reach as per the relative valuation method and or technical analysis taking into consideration both short-term and long-term scenarios.

Note 5: ‘Kalkine reports are prepared based on the stock prices captured either from the New York Stock Exchange (NYSE), NASDAQ Capital Markets (NASDAQ), and or REFINITIV. Typically, all sources (NYSE, NASDAQ, or REFINITIV) may reflect stock prices with a delay which could be a lag of 15-20 minutes. There can be no assurance that future results or events will be consistent with the information provided in the report. The information is subject to change without any prior notice.


Disclaimer-

The advice given by Kalkine Canada Advisory Services Inc. and provided on this website is general information only and it does not take into account your investment objectives, financial situation and the particular needs of any particular person. You should therefore consider whether the advice is appropriate to your investment objectives, financial situation and needs before acting upon it. You should seek advice from a financial adviser, stockbroker or other professional (including taxation and legal advice) as necessary before acting on any advice. Not all investments are appropriate for all people. The website www.kalkine.ca is published by Kalkine Canada Advisory Services Inc. The link to our Terms & Conditions has been provided please go through them. On the date of publishing this report (mentioned on the website), employees and/or associates of Kalkine do not hold positions in any of the stocks covered on the website. These stocks can change any time and readers of the reports should not consider these stocks as advice or recommendations later.