
Rekor Systems, Inc. (NASDAQ: REKR)
Rekor Systems, Inc. (NASDAQ: REKR) is engaged in developing and implementing roadway intelligence systems using artificial intelligence (AI) and machine learning. The Company delivers mission-critical traffic and engineering services.
Fundamental Observation
In Q3 2024, Rekor experienced a 16% rise in gross revenue to $10.5 million, up from $9.1 million in Q3 2023, with a 14% increase in recurring revenue to $5.5 million. The company’s Rekor Discover™ product has been approved by the Florida Department of Transportation, and deployments have started. Despite these revenue gains, delays in revenue recognition from government contracts prompted Rekor to streamline operations, aiming for positive cash flow by 2025 and targeting an annual cost reduction of up to $15 million. The company also decided against seeking an additional $20 million advance from Yorkville Advisors, reflecting confidence in its growth prospects. Revenue growth was primarily driven by the Urban Mobility segment, particularly roadway data aggregation, with Advanced Traffic Data revenues at $1,723,000 for Q3 and $7,428,000 for the nine-month period ending September 30, 2024.
Technical Observation (on the daily chart):
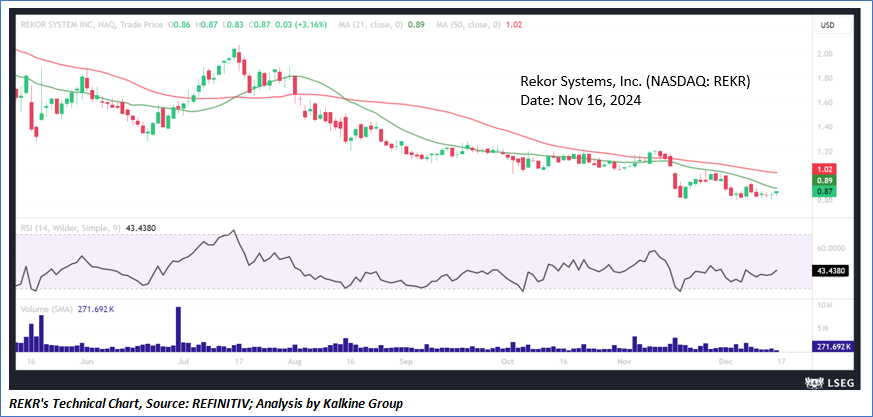
REKR's stock price is currently undergoing a general decline and has recently encountered resistance at key levels, leading to a downward drift. It seems to be entering a prolonged consolidation phase before any potential upward movement. The 14-day Relative Strength Index (RSI) remains below the midpoint, suggesting bearish sentiment. Additionally, the stock is trading below both its 21-period and 50-period Simple Moving Averages (SMAs), which reinforces the negative outlook. Significant support and resistance levels may also function as important demand and supply zones.
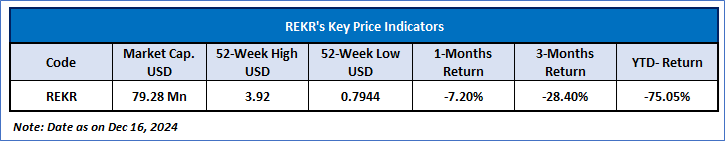
As per the above-mentioned price action, recent key business and financial updates, momentum in the stock over the last month, and technical indicators analysis, a ‘Watch’ rating has been given to Rekor Systems, Inc. (NASDAQ: REKR) at its current market price of USD 0.87 as of Dec 16, 2024 (8:10 am EST).
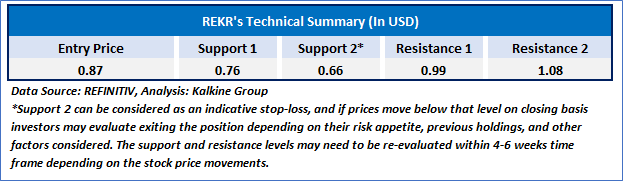
Individuals can evaluate the stock based on the support and resistance levels provided in the report in case of keen interest taking into consideration the risk-reward scenario.
Markets are trading in a highly volatile zone currently due to certain macro-economic issues and prevailing geopolitical tensions. Therefore, it is prudent to follow a cautious approach while investing.
Related Risk: This report may be looked at from a high-risk perspective and a recommendation is provided for a short duration. This report is solely based on technical parameters, and the fundamental performance of the stocks has not been considered in the decision-making process. Other factors which could impact the stock prices include market risks, regulatory risks, interest rates risks, currency risks, social and political instability risks etc.
How to Read the Charts?
The green colour line reflects the 21-period simple moving average (SMA) while the red line indicates the 50- period simple moving average (SMA). SMA helps to identify existing price trends. If the prices are trading above the 21-period and 50-period moving average, then it shows prices are currently trading in a bullish trend.
The black colour line in the chart’s lower segment reflects the Relative Strength Index (14-Period) which indicates price momentum and signals momentum in trend. A reading of 70 or above suggests overbought status while a reading of 30 or below suggests an oversold status.
The volume colour bars in the chart’s lower segment show the volume of the stock. The volume is the number of shares that changed hands during a given day. Stocks with high volumes are more liquid than stocks with lesser volume as liquidity in stocks helps with easier and faster execution of the order.
The Orange colour lines are the trend lines drawn by connecting two or more price points and used for trend identification purposes. The trend line also acts as a line of support and resistance.
Technical Indicators Defined: -
Support: A level at which the stock prices tend to find support if they are falling, and a downtrend may take a pause backed by demand or buying interest. Support 1 refers to the nearby support level for the stock and if the price breaches the level, then Support 2 may act as the crucial support level for the stock.
Resistance: A level at which the stock prices tend to find resistance when they are rising, and an uptrend may take a pause due to profit booking or selling interest. Resistance 1 refers to the nearby resistance level for the stock and if the price surpasses the level, then Resistance 2 may act as the crucial resistance level for the stock.
Stop-loss: It is a level to protect further losses in case of unfavourable movement in the stock prices.
Past performance is neither an indicator nor a guarantee of future performance.
The reference date for all price data, currency, technical indicators, support, and resistance levels is of Dec 16, 2024. The reference data in this report has been partly sourced from REFINITIV.
Abbreviations
CMP: Current Market Price
SMA: Simple Moving Average
RSI: Relative Strength Index
USD: United States dollar
Note: Trading decisions require a thorough analysis by individual. Technical reports in general chart out metrics that may be assessed by individuals before any stock evaluation. The above are illustrative analytical factors used for evaluating stocks; other parameters can be looked at along with additional risks per se. Past performance is neither an indicator nor a guarantee of future performance.
The advice given by Kalkine Canada Advisory Services Inc. and provided on this website is general information only and it does not take into account your investment objectives, financial situation and the particular needs of any particular person. You should therefore consider whether the advice is appropriate to your investment objectives, financial situation and needs before acting upon it. You should seek advice from a financial adviser, stockbroker or other professional (including taxation and legal advice) as necessary before acting on any advice. Not all investments are appropriate for all people. The website www.kalkine.ca is published by Kalkine Canada Advisory Services Inc. The link to our Terms & Conditions has been provided please go through them. On the date of publishing this report (mentioned on the website), employees and/or associates of Kalkine do not hold positions in any of the stocks covered on the website. These stocks can change any time and readers of the reports should not consider these stocks as advice or recommendations later.
 Please wait processing your request...