
Company Overview: Richtech Robotics Inc., (NASDAQ: RR) headquartered in Las Vegas, offers innovative collaborative robotic solutions tailored to the service industry, with a focus on sectors such as hospitality and healthcare. The company specializes in developing robots that enhance efficiency and improve service delivery in these dynamic fields. This Report covers the Price Action, Technical Indicators Analysis along with the Support Levels, Resistance Levels, and Recommendations on this stock.
Latest Update: On October 17, 2024, Richtech Robotics Inc. announced an expansion of its restaurant operations model through a binding Letter of Intent (LOI) with Ghost Kitchens America. As part of the agreement, Richtech Robotics will acquire exclusive rights to operate 20 Walmart-based restaurants in Arizona, Colorado, and Texas. These locations will be managed by the company’s subsidiary, AlphaMax Management LLC, with a focus on enhancing operations using robotics and AI cloud technology.
Financial Update: For the nine months ending June 30, 2024, total revenue was approximately $3.715 million, compared to $3.364 million for the same period in 2023. This represents an increase of 11%, driven by the continued expansion of its customer base and a shift in its sales strategy. For the nine months ending June 30, 2024, gross profit as a percentage of total revenue was approximately 62%, up from about 55% for the same period in 2023. For the nine months ending June 30, 2024, net cash used in operating activities totaled approximately $2.121 million. This was mainly due to a net loss of around $5.181 million, partially offset by a $3.060 million increase in net operating assets and liabilities.
RR’s Technical Analysis:
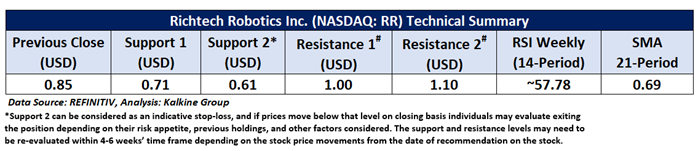
On the daily chart, RR prices are trading above the upward sloping trendline support zone. Moreover, the momentum oscillator RSI (14-period) is showing a reading of ~61.02 level. However, the prices are trading above the trend-following indicator 50-period SMA, which may act as a support level. An important support level for the stock is placed at USD 0.61, while the key resistance level is placed at USD 1.10.

Daily Technical Chart – RR
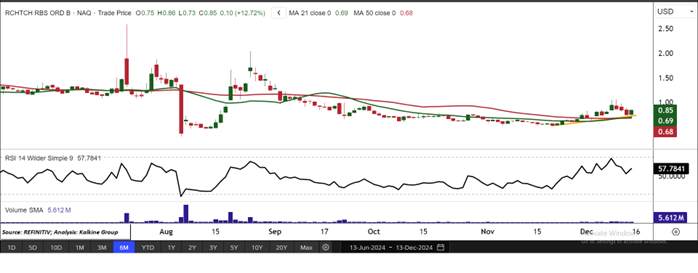
Considering the stock’s current trading above the ascending trendline, and momentum oscillator analysis, a “Speculative Buy” recommendation is given on the stock. The stock was analysed as per the closing price of USD 0.85 per share as on 13 December 2024, up by 12.72%.
Individuals can evaluate the stock based on the support and resistance levels provided in the report in case of keen interest, taking into consideration the risk-reward scenario.
Markets are trading in a highly volatile zone currently due to certain macro-economic issues and prevailing geopolitical tensions. Therefore, it is prudent to follow a cautious approach while investing.
Related Risk: This report may be looked at from a high-risk perspective and a recommendation is provided for a short duration. This report is solely based on technical parameters, and the fundamental performance of the stocks has not been considered in the decision-making process. Other factors which could impact the stock prices include market risks, regulatory risks, interest rates risks, currency risks, social and political instability risks etc.
Note 1: Past performance is not a reliable indicator of future performance.
Note 2: The reference date for all price data, currency, technical indicators, support, and resistance level is December 13, 2024. The reference data in this report has been partly sourced from REFINITIV.
Note 3: Investment decisions should be made depending on an individual's appetite for upside potential, risks, holding duration, and any previous holdings. An 'Exit' from the stock can be considered if the Target Price mentioned as per the Valuation and or the technical levels provided has been achieved and is subject to the factors discussed above.
Note 4: Target Price refers to a price level that the stock is expected to reach as per the relative valuation method and or technical analysis taking into consideration both short-term and long-term scenarios.
Note 5: ‘Kalkine reports are prepared based on the stock prices captured either from the New York Stock Exchange (NYSE), NASDAQ Capital Markets (NASDAQ), and or REFINITIV. Typically, all sources (NYSE, NASDAQ, or REFINITIV) may reflect stock prices with a delay which could be a lag of 15-20 minutes. There can be no assurance that future results or events will be consistent with the information provided in the report. The information is subject to change without any prior notice.
Technical Indicators Defined:
Support: A level at which the stock prices tend to find support if they are falling, and a downtrend may take a pause backed by demand or buying interest. Support 1 refers to the nearby support level for the stock and if the price breaches the level, then Support 2 may act as the crucial support level for the stock.
Resistance: A level at which the stock prices tend to find resistance when they are rising, and an uptrend may take a pause due to profit booking or selling interest. Resistance 1 refers to the nearby resistance level for the stock and if the price surpasses the level, then Resistance 2 may act as the crucial resistance level for the stock.
Stop-loss: It is a level to protect further losses in case of unfavourable movement in the stock prices.
The advice given by Kalkine Canada Advisory Services Inc. and provided on this website is general information only and it does not take into account your investment objectives, financial situation and the particular needs of any particular person. You should therefore consider whether the advice is appropriate to your investment objectives, financial situation and needs before acting upon it. You should seek advice from a financial adviser, stockbroker or other professional (including taxation and legal advice) as necessary before acting on any advice. Not all investments are appropriate for all people. The website www.kalkine.ca is published by Kalkine Canada Advisory Services Inc. The link to our Terms & Conditions has been provided please go through them. On the date of publishing this report (mentioned on the website), employees and/or associates of Kalkine do not hold positions in any of the stocks covered on the website. These stocks can change any time and readers of the reports should not consider these stocks as advice or recommendations later.
 Please wait processing your request...