
Image Source : Krish Capital Pty Ltd
Index Update: Minutes after opening higher than yesterday's close, the benchmark S&P/TSX Composite Index hit an intra-day high of 27,070.18. The index then turned lower, continued to slide and finally settled at 26,903.57, down by 116.71 (or 0.43 %).
Macro Update: PM Mark Carney stated last month that Canada and the US are negotiating to close a deal by July 21. Keeping investors on the hook, the government has not divulged any further details. In the absence of a good trade deal, Trump's tariffs could send Canada into a recession. On the data front, the Ivey Purchasing Managers Index, which measures the month-to-month variation in economic activity revealed an increase from 48.9 in May to 53.3 in June, above market expectations of 49.1. This indicates economic expansion even though hiring showed a slight contraction.
Top Movers: Baytex Energy (9.72%), Vermillion Energy (4.86%), Cenovus Energy (4.06%), and BCE Inc (2.73%) were the prominent gainers.
Our Stance: From a technical standpoint, focus now turns to key support levels. The index is currently trading above the near-term support zone at 26,700, a crucial level for sustaining bullish momentum. If this support holds, it could trigger renewed buying interest and pave the way for a potential rebound toward recent highs. However, a clear break below 26,700 may increase selling pressure and signal the possibility of a deeper correction.
Commodity Update: The dollar strengthened for a third straight session against the yen after U.S. President Trump announced 25% tariffs on Japan and hinted at more trade actions. Gold declined 0.52% to $3,299.70, while silver rose slightly by 0.03% to $36.76. Copper slipped 1.01% to $9,703.55. Brent crude fell 0.30% to $69.91 amid rising U.S. crude inventories and investor caution ahead of further trade announcements.
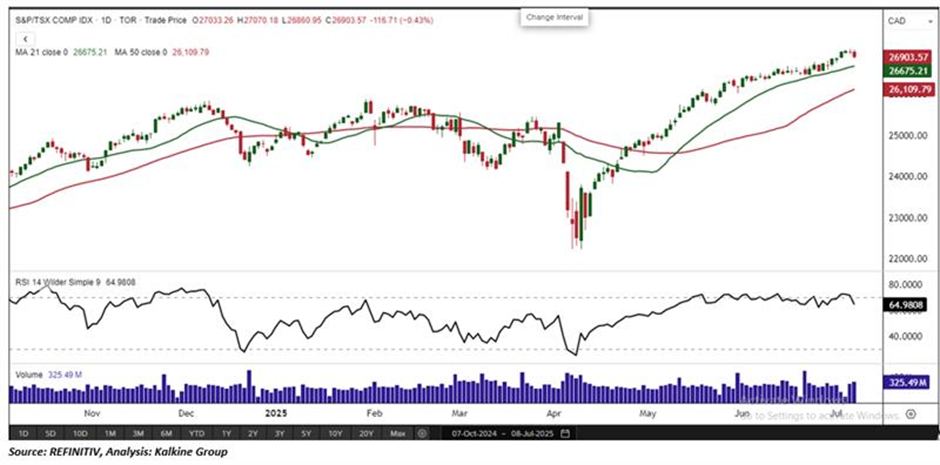
Technical Update: On Tuesday, the S&P/TSX Composite Index closed at 26,903.57, marking a modest decline of 0.43%. The downturn was primarily driven by weakness in the basic materials sector, which posted a notable drop of 3.25%. Despite this pullback, the index continues to trade above its 21-period Simple Moving Average (SMA), indicating that the broader bullish trend remains intact. The SMA serves as an important gauge of market momentum, and the index’s ability to stay above it reinforces the potential for continued upside movement. Additionally, the Relative Strength Index (RSI) stands at 64.98, suggesting a balanced market environment that is neither overbought nor oversold. At present, the index is testing a critical support level near 26,700. Sustaining this level will be vital for preserving the current upward trend. A successful hold above this threshold could lay the groundwork for a renewed rally. However, a decisive break below this support zone may open the door for further downside pressure, potentially leading to a pullback toward the next key support levels in the 26,500 to 26,300 range.
The advice given by Kalkine Canada Advisory Services Inc. and provided on this website is general information only and it does not take into account your investment objectives, financial situation and the particular needs of any particular person. You should therefore consider whether the advice is appropriate to your investment objectives, financial situation and needs before acting upon it. You should seek advice from a financial adviser, stockbroker or other professional (including taxation and legal advice) as necessary before acting on any advice. Not all investments are appropriate for all people. The website www.kalkine.ca is published by Kalkine Canada Advisory Services Inc. The link to our Terms & Conditions has been provided please go through them. On the date of publishing this report (mentioned on the website), employees and/or associates of Kalkine do not hold positions in any of the stocks covered on the website. These stocks can change any time and readers of the reports should not consider these stocks as advice or recommendations later.
 Please wait processing your request...