 CA
CA  AU
AU UK
UK US
US NZ
NZDefinition – Capital Asset Pricing Model (CAPM)
Capital Assets Pricing Model or properly known as CAPM is a statistical model that describes the relationship between the risk and expected return for assets or individual stocks. CAPM is one of the most prominent models used in determining the relationship between the expected return and the market risk or systematic risk.
CAPM is widely adopted by the finance industry for pricing risky securities while generating expected rate on returns on those securities by considering the associated systematic risk or the diversifiable risk.
Apart from that, CAPM is also extensively used to calculate the cost of capital or in particular, the cost of common equity in capital budgeting.
Expected Return on Market
In general, the expected return on market is the total of risk-free rate and a risk premium, i.e., some extra return for the risk innate in the market portfolio.

Where RM = Market risk
Rf = Risk-free rate
In general, as investors want excess return for risk, the risk premium is usually positive. But to find out how positive and to calculate it, the first place to look for it is in the average of the risk premium in the past.
Suppose that the average risk premium for a market is 10 per cent in the last five years and the current risk-free rate is 5 per cent, benchmarked to the current yield on a short term government bond, the expected return of the market would be:
Rm = 5% + 10%
Having understood the expected return on the market is, we will understand the expected return on individual securities or to the CAPM model.
Expected Return on Individual Security
For understanding the expected return of individual security, one needs to be familiar with the concept of beta, which makes up a very crucial part of the CAPM model. So, what is beta?
Beta is defined as the return sensitivity of a stock with respect to the change in the market return, or it could also be defined as the correlation between the expected return of an single asset/security w.r.t the expected return of the market.
Read: Understanding Alpha And Beta
CAPM Formula
The formula for the CAPM model is

Where,
Re = Expected return on a security
Rf = Risk-free rate
Rm = Expected return on market
β = Stock beta
Rm – Rf = Equity risk premium
The above formula entails that the expected return on a security is directly related to its β, and as the average return on the market remains greater than the average risk-free rate, the last part of the equation remains positive.
Calculating Expected Return on an Individual Stock and A Portfolio
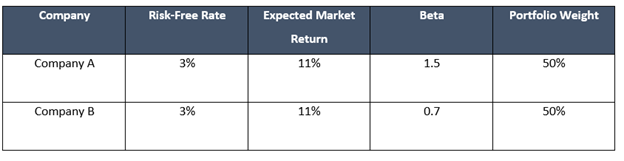
Suppose we have two companies in our portfolio, i.e., Company A and Company B with the following attributes
|
Company |
Risk-Free Rate |
Expected Market Return |
Beta |
|
Company A |
3% |
11% |
1.5 |
|
Company B |
3% |
11% |
0.7 |
Expected return on Company A using CAPM would be
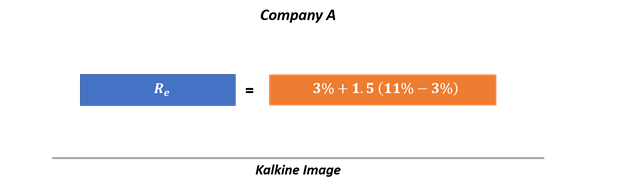
i.e., 15.0%
Likewise, the expected return on Company B would be

i.e., 8.6%
Now imagine a portfolio containing the stock of both the Company A and Company B, what would be the expected return on the portfolio?
To calculate the return on the portfolio (expected), we first need to find the portfolio beta.
Thus, the weighted average beta of the portfolio would be

i.e., 1.1
So, the expected return on the portfolio would be
Rep = 3% + 1.1 (8%)
i.e., 11.8%
Estimating Beta and The Equity Risk Premium
Market model regression of the stock return against the market returns over a pre-determined time period is one method commonly used to estimate a stock’s beta.

Where a is the estimated intercept, and b is the estimated slope of the regression that is used as an estimate of beta. Rst is the return of the stock over the time period t while Rmt is the market return over the time period t.
The derivation of beta is sensitive to the following measures
- Estimation period.
- Periodicity of the return interval.
- Selection of an appropriate market index to fathom the market return.
- Use of a smoothing technique.
- Adjustments for the market capitalisation of the stock.
The estimation of the equity risk premium takes many approaches, including
- Historical equity risk premium approach
It is a well-established approach that assumes that the equity premium noted over a larger time frame is a good gauge of the anticipated equity risk premium.
- Dividend discount model-based approach
The dividend discount model-based approach or the implied-risk premium approach derives the premium by analysing how the market prices an index, one can use the correlation between the value of an index and projected dividends. Thus, assuming a constant growth in dividends:
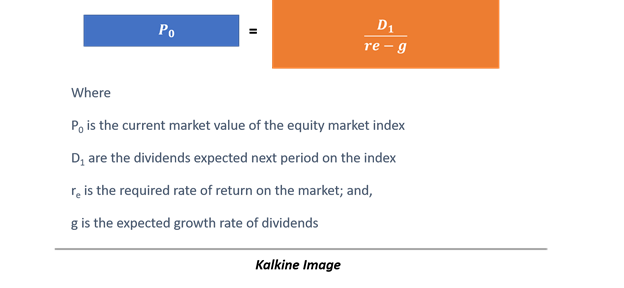
So, the required rate of return on the market could be calculated by rearranging the above equation as below:

So, if the anticipated dividend yield on the index is 10 % and the projected growth rate of dividends is 5 per cent, the projected return on the market would be 15%.
Growth rate can be calculated either by the use of projected growth rate from a vendor or to use a the retention rate, growth rate, and the return on equity relationship as below:
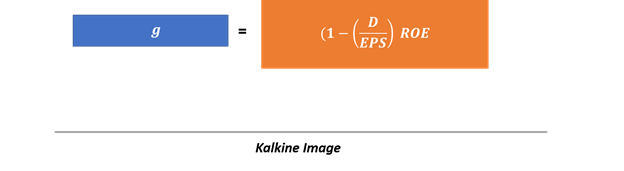
Where D/EPS would be your dividend payout ratio (1 – dividend payout ratio = retention rate), and ROE is the return on equity.
So, if a company has a retention rate of 70 per cent and an ROE of 12 per cent, the dividend growth rate would be 8.4%.
 Please wait processing your request...