Section1: Company Overview and Fundamental Insights:
1.1 Company Overview:
ATS Automation Tooling Systems Inc (TSX: ATS) is a Canada-based company that provides automation systems. The company designs and builds customized automated manufacturing and testing systems for customers and provides pre- and post-automation services. The company generates the majority of its sales from the North American and European markets. Kalkine’s Real Estate Report covers the Investment Highlights, Key Financial Metrics, Risks, Technical Analysis along with the Valuation, Target Price, and Recommendation on the stock.
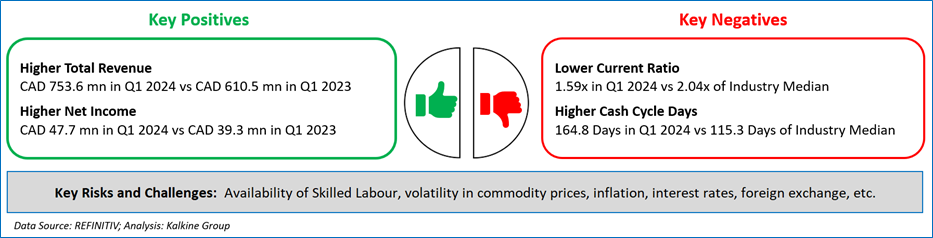
1.2 The Key Positives, Negatives, Investment Highlights and Risks
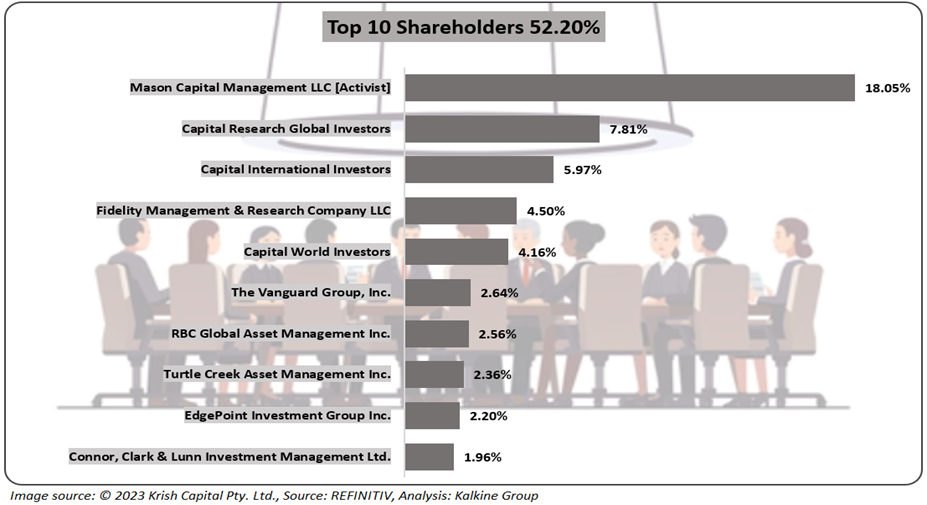
1.3 Top 10 Shareholders:
The top 10 shareholders together form ~52.20% of the total shareholding. Mason Capital Management LLC and Capital Research Global Investors holds a maximum stake in the company at ~18.05% and ~7.81%, respectively.
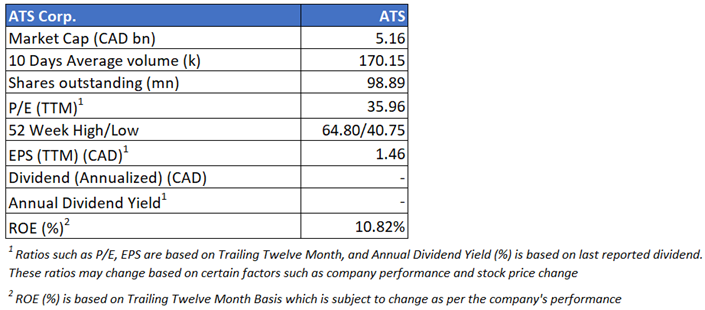
1.4 Key Metrics:
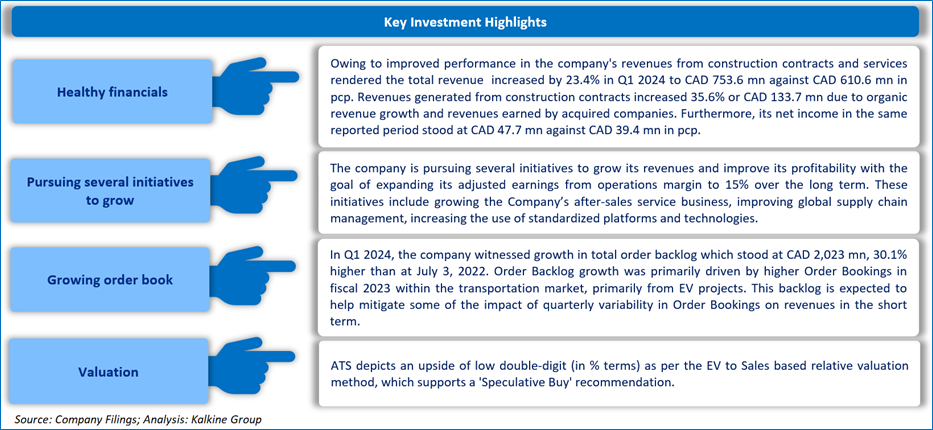
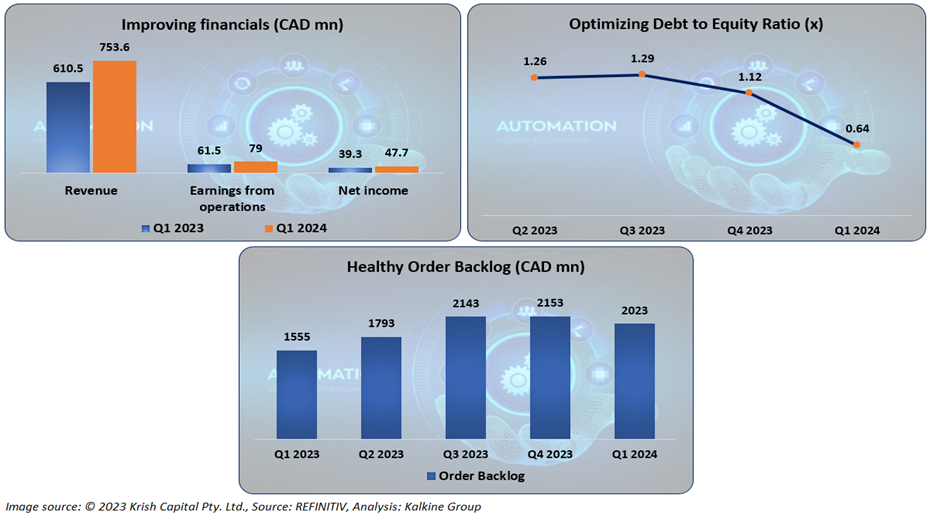
The company reported healthy growth in its financials in Q1 2024, along with a healthy order book, which is a key positive. Furthermore, the group reported falling debt to equity ratio on the sequential basis, which demonstrates its strength and adaptability.
Section 2: Business Updates and Financial Highlights
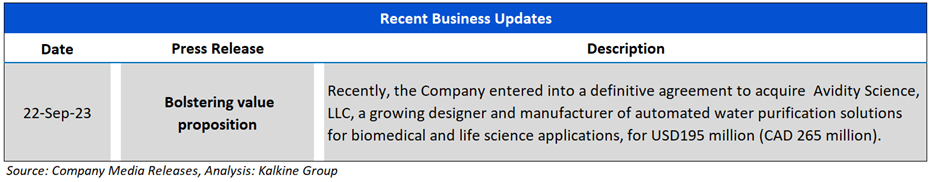
2.1 Recent Updates: The below picture gives an overview of the company’s recent activities, such as the announcement regarding increasing its value proposition.
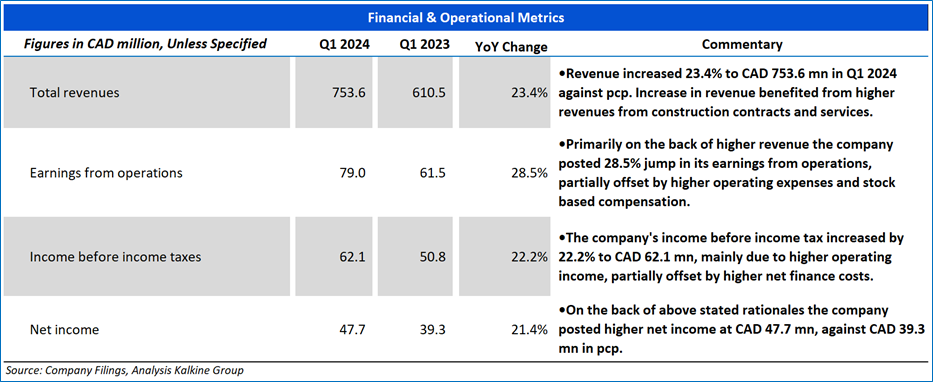
2.2 Insights of Q1 2024 Financial Performance:
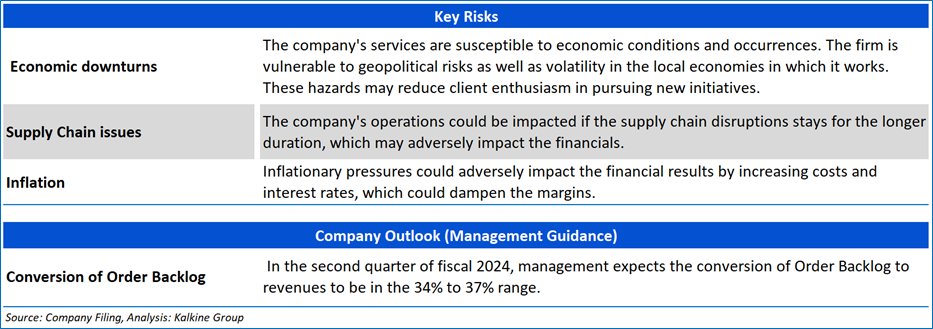
Section 3: Key Risks and Company Outlook
Section 4: Stock Recommendation Summary:
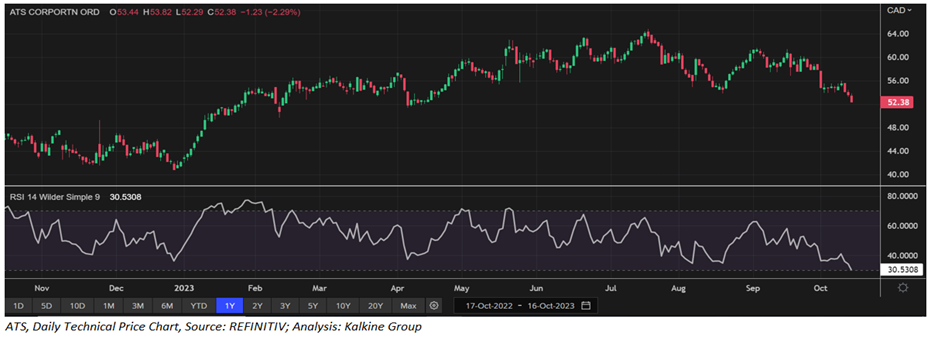
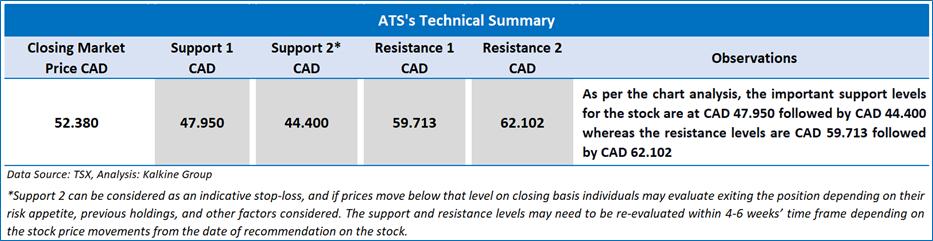
4.1 Price Performance and Technical Summary:

The stock has witnessed a downside of ~4.62% and ~12.52% over the last 1 week and 1 month respectively. Moreover, the stock is trading below the average of 52-week high price of CAD 64.80 and 52-week low price of CAD 40.75 providing an opportunity to accumulate the stock.
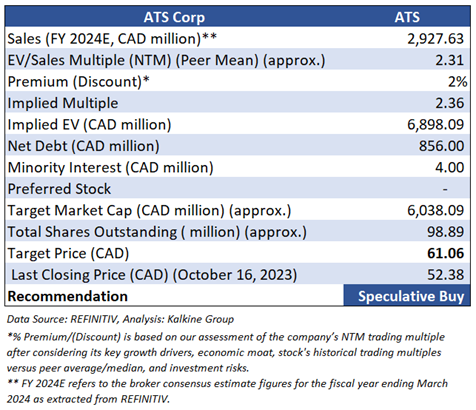
4.2 Fundamental Valuation
Valuation Methodology: EV to Sales Multiple Based Relative Valuation (Illustrative)
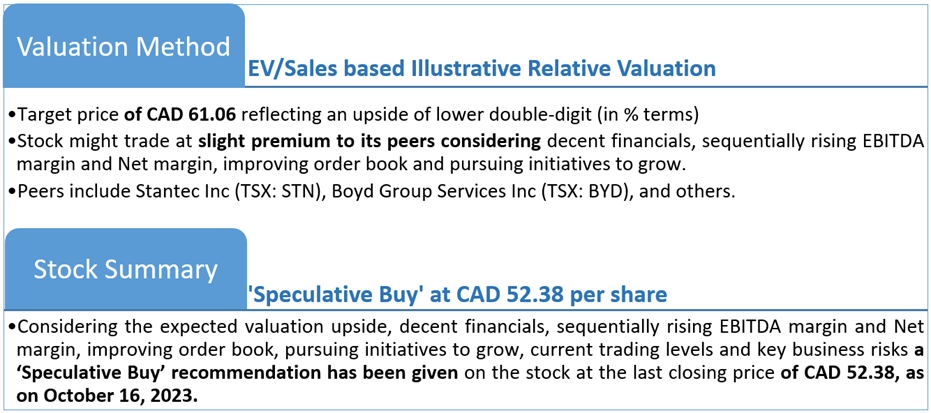
Markets are trading in a highly volatile zone currently due to certain macroeconomic issues and geopolitical tensions prevailing. Therefore, it is prudent to follow a cautious approach while investing.
Note 1: Past performance is not a reliable indicator of future performance.
Note 2: The reference date for all price data, currency, technical indicators, support, and resistance levels is October 16, 2023. The reference data in this report has been partly sourced from REFINITIV.
Note 3: Investment decisions should be made depending on an individual's appetite for upside potential, risks, holding duration, and any previous holdings. An 'Exit' from the stock can be considered if the Target Price mentioned as per the Valuation and or the technical levels provided has been achieved and is subject to the factors discussed above.
Technical Indicators Defined: -
Support: A level at which the stock prices tend to find support if they are falling, and a downtrend may take a pause backed by demand or buying interest. Support 1 refers to the nearby support level for the stock and if the price breaches the level, then Support 2 may act as the crucial support level for the stock.
Resistance: A level at which the stock prices tend to find resistance when they are rising, and an uptrend may take a pause due to profit booking or selling interest. Resistance 1 refers to the nearby resistance level for the stock and if the price surpasses the level, then Resistance 2 may act as the crucial resistance level for the stock.
Stop-loss: It is a level to protect further losses in case of unfavourable movement in the stock prices.
Disclaimer
The advice given by Kalkine Canada Advisory Services Inc. and provided on this website is general information only and it does not take into account your investment objectives, financial situation and the particular needs of any particular person. You should therefore consider whether the advice is appropriate to your investment objectives, financial situation and needs before acting upon it. You should seek advice from a financial adviser, stockbroker or other professional (including taxation and legal advice) as necessary before acting on any advice. Not all investments are appropriate for all people. The website www.kalkine.ca is published by Kalkine Canada Advisory Services Inc. The link to our Terms & Conditions has been provided please go through them. On the date of publishing this report (mentioned on the website), employees and/or associates of Kalkine do not hold positions in any of the stocks covered on the website. These stocks can change any time and readers of the reports should not consider these stocks as advice or recommendations later.
Past performance is not a reliable indicator of future performance.

 Please wait processing your request...