Company Overview: Enterprise Products Partners L.P. (Enterprise) is a provider of midstream energy services to producers and consumers of natural gas, natural gas liquids (NGLs), crude oil, petrochemicals and refined products in North America. The Company's segments include NGL Pipelines & Services; Crude Oil Pipelines & Services; Natural Gas Pipelines & Services, and Petrochemical & Refined Products Services. The Company's midstream energy operations include natural gas gathering, treating, processing, transportation and storage; NGL transportation, fractionation, storage, and import and export terminals, including liquefied petroleum gas (LPG); crude oil gathering, transportation, storage and terminals; petrochemical and refined products transportation, storage, export and import terminals, and related services, and a marine transportation business that operates primarily on the United States inland and Intracoastal Waterway systems.

EDP Details
Project Pipeline to Aid Higher Business Prospects: Enterprise Products Partners L.P. (NYSE: EPD) is a leading midstream energy services provider to producers and consumers of natural gas, NGLs, crude oil, petrochemicals and refined products. The company’s integrated midstream energy asset network links producers of natural gas, NGLs and crude oil from some of the largest supply basins in the U.S., Canada and Gulf of Mexico with domestic consumers and international markets. The company’s operations are reported under four business segments: (i) NGL Pipelines & Services, (ii) Crude Oil Pipelines & Services, (iii) Natural Gas Pipelines & Services, and (iv) Petrochemical & Refined Products Services. EPD’s assets currently include ~50,000 miles of pipelines, 260 MMBbls (million barrels) of storage capacity for NGLs, crude oil, petrochemicals and refined products, and 14 Bcf of natural gas storage capacity.
For the financial year ended on December 2018, total net revenue stood at $36,534.2 million, posting a growth of 24.94% as compared to $29,241.50 million during FY17. Net profit for the company was recorded at $4,238.50 million, up 48.43% from $2,855.6 million reported in FY17. Looking at the past performance, EPD delivered a CAGR growth of ~10.57% in revenue over the period of FY15 to FY18, while net profit posted a CAGR growth of ~18.33% during the same period.
EPD has a work in progress of $9.1 billion of growth capital projects while these projects are scheduled to begin service between now and the end of CY23. The company expects ~$3.0 billion of growth capital projects to be completed and begin commissioning over the next two quarters. These projects are likely to enhance the cash flow per unit while maintaining a strong balance sheet.
Going forward, the company is looking to adopt several strategies like to capitalize on expected demand growth, including exports, for natural gas, NGLs, crude oil and petrochemical and refined products and maintaining a diversified portfolio of midstream energy assets. The company intends to expand this asset base through growth capital projects and accretive acquisitions of complementary midstream energy assets, enhancing the stability of cash flows by investing in pipelines and other fee-based businesses. The business is likely to share its capital costs and diversify risks through business ventures or strategic alliances, including those businesses, which provide processing, throughput or feedstock volumes for growth capital projects or the purchase of such projects’ end product.
.png)
Past Financial Performance over FY15-FY18 (Source: Company Reports)
Q3FY19 Financial Highlights for the Period Ended 30 September 2019: EPD declared its Q3FY19 financial results wherein, the company reported revenue of $7,964.1 million as compared to $9,585.9 million in Q3FY18. Total revenue for the quarter decreased $1.62 billion from the third quarter of 2018, primarily due to a net $1.61 billion decrease in marketing revenues. Sales from the marketing of NGLs, petrochemicals and refined products decreased a combined net $1.38 billion quarter-to-quarter, primarily due to lower sales prices, which accounted for a $2.04 billion decrease, partially offset by the effects of higher sales volumes, which resulted in a $657.3 million increase. The company reported a net income of $1,044.8 million in Q3FY19 as compared to $1,334.6 million in the previous corresponding period. During Q3FY19, EPD reported lower operating costs and expenses at $6,573.7 million as compared to $8,001.9 million in Q3FY18. General and administrative costs stood at $6,629.2 million as compared to $8,054.6 million in the previous corresponding period. The business reported cash and cash equivalent at $1,207.8 million, total assets at $61,015.3 million and total equity of $25,525.5 million as on 30 September 2019.
.png)
Income Statement (Source: Company Reports)
Segment-wise Performance:
NGL Pipelines & Services: This segment reported revenue of $3252.1 million as compared to $4,622.9 million in the previous corresponding period. The gross operating margin of NGL Pipelines & Services stood at $288 million for the Q3FY19 as compared to $397 million in Q3FY18. The decrease in margin was due to lower processing margins, a decrease in equity NGL production and higher operating expenses, which more than offset the benefit of a 47% increase in fee-based processing volumes at the Permian Basin plants. The segment reported a volume of 3.6 million BPD (barrels per day)for the third quarter of FY19, while the segment contributed 40.83% of the total revenue.
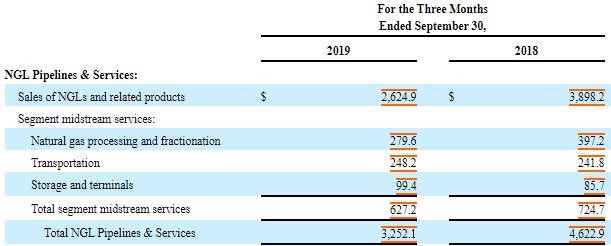
NGL Pipelines & Services’ Q3FY19 results (Source: Company Reports)
Crude Oil Pipelines & Services: This segment derived 31.12% of the total business revenue at $2,478.3 million as compared to $2,494.9 million in the previous corresponding period. Gross operating margin from the Crude Oil Pipelines & Services stood $496 million for the Q3FY19. The above margin includes $10 million of non-cash, mark-to-market gains on financial instruments related to crude oil pipeline hedging activities. Total crude oil pipeline transportation volumes increased 21% to 2.3 million BPD for the Q3FY2019 as compared to 1.9 million BPD for the Q3FY18. Total crude oil marine terminal volumes increased 56% on y-o-y basis to a record 987 MBPD during Q3FY19 from 632 MBPD in Q3FY18.
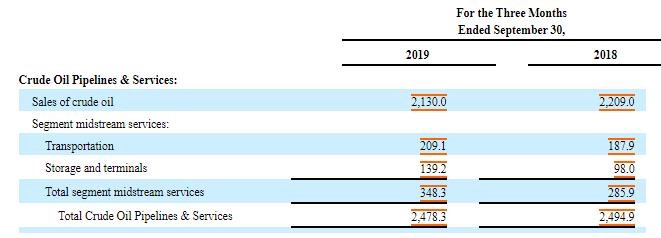
Crude Oil Pipelines & Services’ Q3FY19 results (Source: Company Reports)
Natural Gas Pipelines & Services: This segment reported 8.98% of the total income and reported a top-line of $715.5 million during Q3FY19 as compared to $850.2 million in the previous corresponding period. Gross operating margin from the natural gas pipelines & services segment increased 19% on y-o-y basis to $259 million during Q3FY19 on account of higher average sales margins that benefitted from regional natural gas price spreads across Texas. Volumes from the segment stood at 4.7 TBtu/d in Q3FY19 as compared to 4.6 TBtu/d in Q3FY18.
.png)
Natural Gas Pipelines & Services’ Q3FY19 Results (Source: Company Reports)
Petrochemical & Refined Products Services: Top-line from the segment came in at $1,518.2 million as compared to $1,617.9 million in the previous corresponding period, representing 19.06% of the total income. Gross operating margin for the Petrochemical & Refined Products Services stood at $288 million, increase 16% on y-o-y basis. Total segment pipeline transportation volumes came in at 747 MBPD during Q3FY19 as compared to 796 MBPD for Q3FY18. Gross operating margin from the partnership’s propylene business stood at 131 million for Q3FY19, an increase of 39% y-o-y basis. Total propylene production volumes stood at 105 MBPD during this quarter, registering a 13% growth on y-o-y basis.
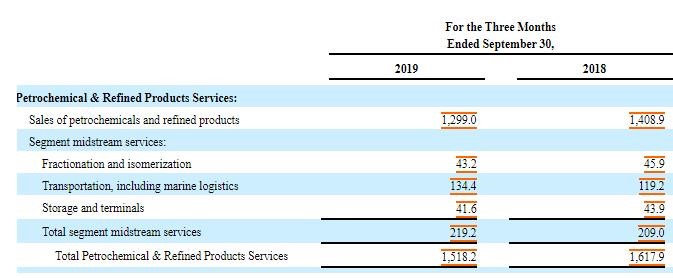
Petrochemical & Refined Products Services Q3FY19 Results (Source: Company Reports)
Recent Updates:
EPD repurchased 2,909,128 common units under the 2019 Buyback Program through open market purchases during the nine months ended September 30, 2019. In October 2019, the company announced an expansion of the ATEX ethane pipeline. The 1,192-mile ATEX pipeline transports ethane from the Marcellus/Utica Basin of Pennsylvania, West Virginia and Ohio to NGL storage complex in Mont Belvieu, Texas.
Recently, the company announced a long-term collaboration that is expected to drive future expansion of the Midland-to-ECHO crude oil pipeline network. EPD will further construct a fourth pipeline that will connect Midland terminal in Midland, Texas with the ECHO terminal in Houston, Texas. Transportation capacity of the Midland-to-ECHO 4 pipeline is expected within 450 MBPD and can be expanded up to 540 MBPD.
During September 2019, the company announced the execution of long-term contracts with affiliates of LyondellBasell Industries N.V. and the association is expected to support construction of the second propane dehydrogenation plant which is likely to have the capacity to consume up to 35 MBPD of propane and produce up to 1.65 billion pounds per year of polymer grade propylene.
Top 10 Shareholders: The top 10 shareholders have been highlighted in the table which, together forms around 44.46% of the total shareholding. Williams (Randa Duncan), and Harvest Fund Advisors LLC hold the maximum interest in the firm at 31.88% and 2.34%, respectively.
.png)
Top 10 Shareholders (Source: Thomson Reuters)
Key Metrics: EPD posted decent margins in the third quarter of FY19. Operating margins for the quarter came in at 18.5%, stood above the industry median of 15.2%. Net margin at 13.1% also remained well above the industry median of 6.1%. Return on Equity (ROE) stood at 4.2%, ahead of the industry median of 1.7%.
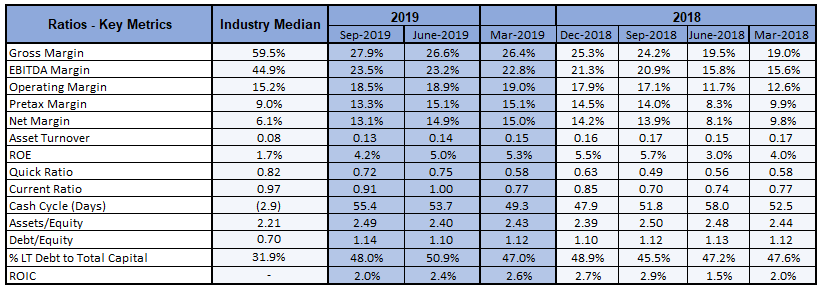
Key Ratio Metrics (Source: Thomson Reuters)
(18).png)
Key Valuation Metrics (Source: Thomson Reuters)
Guidance: The Management anticipates that the distributions for FY19 would be ~$1.7650 per unit, 2.3% higher than $1.7250 per unit in FY18. As per the Management guidance, Shin Oak pipeline is expected to ramp to 550 MBPD of transportation capacity in 4QFY19. Front range pipeline is expected to ramp 255 MBPD of capacity in CY21. The business expects to deliver 330 MBPD of capacity in CY22 from Texas Express pipeline.
Valuation Methodologies:
Method 1: PE Based Valuation:
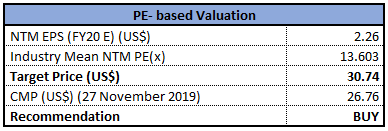
PE Based Valuation (Source: Thomson Reuters), *NTM-Next Twelve Months
Method 2: EV/Sales Based Valuation:
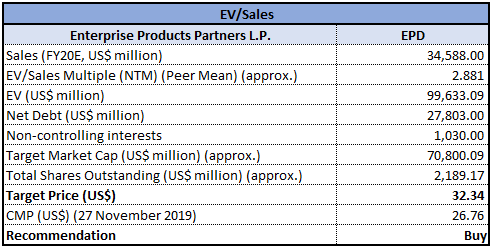
EV/Sales Based Valuation (Source: Thomson Reuters), *NTM-Next Twelve Months
Note: All forecasted figures and peers have been taken from Thomson Reuters, *NTM-Next Twelve Months
Stock recommendation: The stock of EPD closed at $26.76 with a price to earnings multiple of 12.33x while the stock has a market capitalization of ~$58.582 billion. The stock price has given a negative return of 5.173% and 4.085% in the last three months and six months, respectively. EPD at the end of September 2019, reported cash flow from operation at $1.6 billion, 4% higher on y-o-y basis. Volumes of NGL, crude oil, refined products & petrochemical pipeline stood at 6.6 BPD during Q3FY19 from 6.2 BPD in Q3FY18. The business witnessed decent momentum, reflecting the quality of the fee-based businesses. The recent partnership sets six operational records, which include total equivalent pipeline volumes, natural gas pipeline volumes, NGL fractionation volumes, crude oil marine terminal volumes and propylene production volumes. The business successfully sanctioned two expansions within the Midland-to-ECHO crude oil pipeline system and the second propane dehydrogenation facility. In total, the company currently has $9.1 billion of growth capital projects under construction. Considering the aforesaid facts, we have valued the stock, using two relative valuation methods, i.e., price to earnings multiple, and Enterprise Value to Sales multiple, and arrived at a target price of lower double-digit growth (in % term). Hence, we recommend a “Buy” rating on the stock at the closing price of $26.76, up 1.25% as on 27 November 2019.
.jpg)
EPD Daily Technical Chart (Source: Thomson Reuters)
Disclaimer
The advice given by Kalkine Pty Ltd and provided on this website is general information only and it does not take into account your investment objectives, financial situation or needs. You should therefore consider whether the advice is appropriate to your investment objectives, financial situation and needs before acting upon it. You should seek advice from a financial adviser, stockbroker or other professional (including taxation and legal advice) as necessary before acting on any advice. Not all investments are appropriate for all people. Kalkine.com.au and associated websites are published by Kalkine Pty Ltd ABN 34 154 808 312 (Australian Financial Services License Number 425376). The information on this website has been prepared from a wide variety of sources, which Kalkine Pty Ltd, to the best of its knowledge and belief, considers accurate. You should make your own enquiries about any investments and we strongly suggest you seek advice before acting upon any recommendation. Kalkine Pty Ltd has made every effort to ensure the reliability of information contained in its newsletters and websites. All information represents our views at the date of publication and may change without notice. To the extent permitted by law, Kalkine Pty Ltd excludes all liability for any loss or damage arising from the use of this website and any information published (including any indirect or consequential loss, any data loss or data corruption). If the law prohibits this exclusion, Kalkine Pty Ltd hereby limits its liability, to the extent permitted by law to the resupply of services. There may be a product disclosure statement or other offer document for the securities and financial products we write about in Kalkine Reports. You should obtain a copy of the product disclosure statement or offer document before making any decision about whether to acquire the security or product. The link to our Terms & Conditions has been provided please go through them and also have a read of the Financial Services Guide. On the date of publishing this report (mentioned on the website), employees and/or associates of Kalkine Pty Ltd do not hold positions in any of the stocks covered on the website. These stocks can change any time and readers of the reports should not consider these stocks as advice or recommendations.
Past performance is not a reliable indicator of future performance.

 Please wait processing your request...