Company Overview: Enterprise Products Partners L.P. (Enterprise) is a provider of midstream energy services to producers and consumers of natural gas, natural gas liquids (NGLs), crude oil, petrochemicals and refined products in North America. The Company's segments include NGL Pipelines & Services; Crude Oil Pipelines & Services; Natural Gas Pipelines & Services, and Petrochemical & Refined Products Services. The Company's midstream energy operations include natural gas gathering, treating, processing, transportation and storage; NGL transportation, fractionation, storage, and import and export terminals, including liquefied petroleum gas (LPG); crude oil gathering, transportation, storage and terminals; petrochemical and refined products transportation, storage, export and import terminals, and related services, and a marine transportation business that operates primarily on the United States inland and Intracoastal Waterway systems.
.png)
EPD Details
Spectacular growth in Earnings over last few years: Enterprise Products Partners L.P. (NASDAQ: EPD) is a leading provider of midstream energy services to producers and consumers of natural gas, natural gas liquids (NGLs), petrochemicals, crude oil and refined products. The firm offers its services with the asset portfolio of approximately 49,200 miles of pipelines, 260 million barrels of storage capacity for NGLs, crude oil, refined products and petrochemicals along with 14 Bcf (billion cubic feet per day) of natural gas storage capacity. EPD performed excellently during FY18 with top-line at $36,534.2 million against $29,241.5 million in FY17, posting a yoy growth of 24.94%. In-line with the revenue, bottom-line also posted a robust growth of 49.05% to $4,172.4 million from $2,799.3 million in FY17. The exuberant growth in top-line and profitability during FY18 was largely driven by the segments – NGL Pipelines & Services and Crude oil & Pipelines Services with revenue growth of 25.5% and 35.38%, respectively. Diluted earnings per share (EPS) for FY18 came in at $1.91 against $1.30 in FY17. Total assets of the business were valued at $56,969.8 million along with the total debt of $26,178.2 million at the end of FY18. EPD reported 29% growth (yoy) in total gross operating margin to a record $7.3 billion in FY18. Net cash flow from operating activities (CFFO) grew by 31% to a record $6.1 billion during FY18. Distributions to limited partners announced during 2018 were $3.8 billion, or 62% of CFFO. Free cash flow in FY18 increased 50% (y-o-y) to a record $2.0 billion. The year 2018 was remarkable as the business EPD completed the construction and started commercial activities or ramped up volumes on assets amounting over $5 billion of capital investment. Along with this, EPD loaded the first VLCC at a Texas port. During the year, EPD established a collaboration with CME Group for a new WTI Houston Crude Oil futures contract.
The International Energy Agency (IEA) updated about the global demand for crude oil and NGLs growing by a combined 1.3 million BPD in 2018 and anticipates a further rise in the demand by 1.4 million BPD in 2019. Going forward, with the economic growth and continuous rising demand of crude oil, NGLs and natural gas, higher focus to reduce greenhouse gas emissions, EPD is well-positioned to cater the emerging needs and thus, generating the wealth for its shareholders.
.png)
Historical Financial Performance (Source: Company Reports)
Q2FY19 Highlights:
EPD posted revenue of $8,276.3 million during the quarter against $8,467.5 million during Q2FY18 while net income attributable to limited partners came in at $1,214.7million from $637.8 million in the previous corresponding quarter. Total operating costs and expenses stood at $6,800.9 million against $7,552 million during Q2FY18. Cash balance stood at $107.3 million with total Current assets valued at $6,258.9 million, including accounts receivable at $3,787.6 million, Inventories at $1,586.1 million at the end of the quarter. The Firm’s plant property and equipment stood at $40,089.1 million with an investment of $2,652.1 million and goodwill valuation of $5,745.2 million at the end of 30th June 2019. Long-term debt at the end of the quarter stood at $26,385 million with total equity stood at $24,975.4 million.
Segment-wise Performance During Q2FY19: EPD derives the revenues from contracts with customers. In total, product sales and midstream services accounted for 82% and 18%, respectively, of consolidated revenues for the three months ended June 30, 2019.
NGL Pipelines & Services: The segment recorded top-line of $3,284.7 million during the period as compared with $3,273.7 in Q2FY18. Gross operating margin at $966.3 million came in above $913.7 million in Q2FY18. Total fee-based processing volumes increased to 5.2 Bcf/d in Q2FY19 against 4.6 Bcf/d in Q2FY18. NGL production stood at 144 MBPD for the second quarter of 2019 versus 164 MBPD for the second quarter of last year.
.png)
Gross Operating Margin - NGL Pipelines & Services (Source: Company Reports)
Crude Oil Pipelines & Services: The segment posted a revenue of $2,866.6 million during the quarter as compared to $2,781.2 million in 2QFY18. Gross operating margin for the segment came in at $513.2 million against $52.8 million in the prior corresponding period. Total crude oil pipeline transportation volumes increased by 19% to 2.4 million BPD for Q2FY19. Total crude oil marine terminal volumes were increased by 23% pcp to a record 985 MBPD. During the quarter Firm’s share of gross margin with Seaway pipeline reported growth by $20 million from Q2FY18 aided by higher transportation fees and volumes expansion of the pipeline completed in the first quarter of 2019.
.png)
Gross Operating Margin - Crude Oil Pipelines & Services (Source: Company Reports)
Natural Gas Pipelines & Services: The segment’s contributed the revenue of $819.3 million as compared to $792.8 million during Q2FY18. The segment saw a gross operating margin of $301.8 million against $ 213.4 million in Q2FY18 due to the higher realisation from regional natural gas price spreads across Texas. Increased production from the Haynesville area resulted in a 145 BBtus/d increase in volumes.
.png)
Gross Operating Margin - Natural Gas Pipelines & Services (Source: Company Reports)
Petrochemical & Refined Products Services: The segment witnessed a revenue of $1,305.7 million with gross operating margin at $304.9 million during the quarter against $1,619.8 million and $281.8 million, respectively, in Q2FY18. Pipeline transportation volumes came in at 672 MBPD during the quarter as compared to 771 MBPD in Q2FY18. Propylene production volumes stood at 107 MBPD against 100 MBPD in Q2FY18.
.png)
Gross Operating Margin - Petrochemical & Refined Products Services (Source: Company Reports)
Recent Updates:
EPD and Altus jointly acquire 33% stake in Shin Oak: Recently, EPD confirmed that it has acquired 33% stake in Shin Oak Pipeline in collaboration with Altus Midstream Company (NASDAQ: ALTM). Shin Oak Pipeline transports NGL from multiple basins, including the Permian to Enterprise’s NGL fractionation and storage complex in Mont Belvieu, Texas. Shin has a pipeline base of 658-mile and the Management believes that the above acquisition is likely to enhance EPD’s presence to Permian Basin. The Management intends to expand Shin’s capacity to transport 550,000 barrels of NGLs per day and the above expansion is likely to be completed within Q4FY19.
EPD and Chevron collaborated to support offshore crude oil port: With the recent update, EPD has collaborated with Chevron U.S.A. Inc. (CUSA), a wholly owned subsidiary of Chevron Corporation (NYSE: CVX) to develop Enterprise’s Sea Port Oil Terminal (SPOT) in the Gulf of Mexico. The above project consists of onshore and offshore facilities, including a fixed platform at 115 feet of water, located at Brazoria County, Texas coast. SPOT is designed to load Very Large Crude Carriers (VLCCs) at rate of approximately 85,000 barrels per hour, or up to approximately 2 million barrels per day.
Key Developments in FY18: The firm accomplished major achievements in 2018 as EPD completed the construction and started commercial activities or ramped up volumes on assets amounting over $5 billion of capital investment. These new assets included PDH facility, Midland-to-ECHO 1 crude oil pipeline, ninth NGL fractionator at Mont Belvieu-area complex, and two natural gas processing plants serving the Delaware Basin of the Permian. Due to the growing global demand for PGP (polymer-grade propylene), the Management is in discussions with several customers for the development of a second PDH facility. Another notable achievement during the year was loading the first VLCC (has a 75-foot draft and can transport two million barrels of crude oil) at a Texas port.
In September 2018, the business announced a pilot program with the joint collaboration with CME Group, for a new WTI Houston Crude Oil futures contract with three delivery points on Enterprise’s system. Houston-area distribution network of the firm connects via an extensive network of pipelines, storage facilities and marine terminals with an access of over 4 million BPD of crude oil supply from the major producing basins in the U.S. and Canada, making it an ideal pricing point.
Top 10 Shareholders: The top 10 shareholders have been highlighted in the table which together form around 44.27% of the total shareholding. Williams (Randa Duncan), and Harvest Fund Advisors LLC hold the maximum interest in the firm at 31.88% and 2.32%, respectively.
.png)
Top 10 Shareholders (Source: Thomson Reuters)
Key Metrics: EPD posted decent margins in the second quarter of FY19. Operating margins for the quarter at 18.9% was mildly above the industry median of 18.4%.Net margin at 14.9% also remained well above the industry median of 6.4% during the period. Return on Equity (RoE) stood at 5.0%, ahead of the industry median of 1.6%.
.png)
Key Ratio Metrics (Source: Thomson Reuters)
Industry Outlook: The macro-economic outlook for the energy sector continues to expand aided by the economic growth, initiatives to reduce greenhouse gas emissions, and the intension by developing countries to improve standards of living. U.S. Shale gas is playing a pivotal role by supplying lower energy prices to the end use consumer. As per International Energy Agency (“IEA”) report, the demand for global crude oil and NGLs is expected grow by 1.4 million BPD in CY2019. U.S. exports of natural gas have doubled since 2015. Most of the demand is coming from the markets of Asia and Europe due to commencement of new power generation facilities or displace coal at existing power plants to reduce emissions and improve air quality.
.png)
Key Valuation Metrics (Source: Thomson Reuters)
Guidance: The management provided the distributions guidance for FY19 of ~$1.765 per unit, an increase of 2.3% from 2018. EPD began FY19 with $6.7 billion of growth capital projects under construction. The company has a number of infrastructure projects under development, which includes, (a) Conversion of one EPD Seminole NGL pipeline to crude oil service, (b) Shin Oak NGL pipeline, (c) Third Orla and Mentone natural gas processing plants, (d) Two new NGL fractionators at Mont Belvieu Complex, and (e) New ethylene export terminal.
Valuation Methodologies:
Method 1: PE Based Valuation (NTM):

PE-Based Valuation (Source: Thomson Reuters), *NTM-Next Twelve Months
Method 2: EV/EBITDA Based Valuation (NTM):
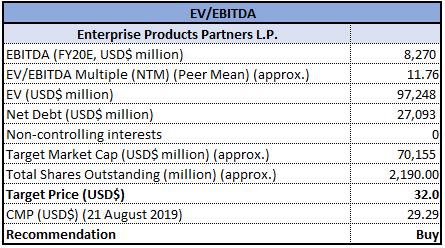
EV/EBITDA Based Valuation (Source: Thomson Reuters), *NTM-Next Twelve Months
Note: All forecasted figures and peers have been taken from Thomson Reuters, *NTM-Next Twelve Months
Stock recommendation: On 21st August 2019, the stock of EPD closed at $29.29 with price to earnings multiple of 12.68x against industry median of 15.02x. During Q2FY19, EPD posted net profit margin at 14.9%, higher than industry median ~6.4%. Gross operating margin during the quarter ended came in at 41% to $2.1 billion. EPD’s ROE and asset turnover ratio at the end of second quarter stood at 5% and 0.14x, respectively, well above the industry median 1.6% and 0.07x. D/E ratio at the end of Q2FY19 stood at 1.10x against 1.12x during Q1FY19.
Significant progress over the last few years, major projects development, tie-ups and collaboration with big companies, emerging global demand with bright industry outlook, etc., augur well for the future prospects of the business. We believe that the business will continue to grow along with improved margins backed up by its recent acquisitions. Based on the foregoing, we have valued the stock using two relative valuation methods, P/E and EV/EBITDA multiple and have arrived at the target price in the ambit of $32.0 to $33.9 (high single-digit to low double-digit growth (in %)). Hence, we recommend a “Buy” rating on the stock at the current market price of $29.29 per share, up 0.45% on 21 August 2019.
.png)
EDP Daily Technical Chart (Source: Thomson Reuters)
Disclaimer
The advice given by Kalkine Pty Ltd and provided on this website is general information only and it does not take into account your investment objectives, financial situation or needs. You should therefore consider whether the advice is appropriate to your investment objectives, financial situation and needs before acting upon it. You should seek advice from a financial adviser, stockbroker or other professional (including taxation and legal advice) as necessary before acting on any advice. Not all investments are appropriate for all people. Kalkine.com.au and associated websites are published by Kalkine Pty Ltd ABN 34 154 808 312 (Australian Financial Services License Number 425376). The information on this website has been prepared from a wide variety of sources, which Kalkine Pty Ltd, to the best of its knowledge and belief, considers accurate. You should make your own enquiries about any investments and we strongly suggest you seek advice before acting upon any recommendation. Kalkine Pty Ltd has made every effort to ensure the reliability of information contained in its newsletters and websites. All information represents our views at the date of publication and may change without notice. To the extent permitted by law, Kalkine Pty Ltd excludes all liability for any loss or damage arising from the use of this website and any information published (including any indirect or consequential loss, any data loss or data corruption). If the law prohibits this exclusion, Kalkine Pty Ltd hereby limits its liability, to the extent permitted by law to the resupply of services. There may be a product disclosure statement or other offer document for the securities and financial products we write about in Kalkine Reports. You should obtain a copy of the product disclosure statement or offer document before making any decision about whether to acquire the security or product. The link to our Terms & Conditions has been provided please go through them and also have a read of the Financial Services Guide. On the date of publishing this report (mentioned on the website), employees and/or associates of Kalkine Pty Ltd do not hold positions in any of the stocks covered on the website. These stocks can change any time and readers of the reports should not consider these stocks as advice or recommendations.
Past performance is not a reliable indicator of future performance.

 Please wait processing your request...