Company Overview: Expedia Group, Inc., formerly Expedia, Inc., is an online travel company. The Company operates through four segments: Core Online Travel Agencies (Core OTA), trivago, Egencia and HomeAway. The Company's Core OTA segment provides a range of travel and advertising services to its customers across the world, through a range of brands, including Expedia.com and Hotels.com in the United States, and localized Expedia and Hotels.com Websites throughout the world, Orbitz.com, Expedia Affiliate Network, Hotwire.com, Travelocity, Wotif Group, CarRentals.com and Classic Vacations. The Company's trivago segment sends referrals to online travel companies and travel service providers from its hotel metasearch Websites. Its Egencia segment, which also includes Orbitz Worldwide (Orbitz) for Business, provides managed travel services to corporate customers across the world. The Company's HomeAway segment operates an online marketplace for the vacation rental industry.
.png)
EXPE Details
Expedia Group Inc (NASDAQ: EXPE), formerly Expedia Inc., along with its subsidiaries, provides an online travel platform for the United States and around the world. The company works through the segments like Core OTA, Hotels.com, Trivago, HomeAway, and Egencia. The group has been witnessing healthy gross bookings scenario with support coming in through HomeAway segment along with Expedia and Expedia Partner Solutions. The top-line of the company thus gets a boost from the above with enhanced footprint at domestic front (domestic stayed room nights). Lodging revenues from its portfolio are also helping the group while trivago segment has demonstrated some challenges. The competition for the group in the online travel space has been noted while it is putting efforts to mitigate the scenario.
.png)
Strategies to manage Competition (Source: Company Reports)
Better than expected performance for fourth quarter 2018: For the fourth quarter of 2018, the company has posted better than expected results. EXPE in the fourth quarter of FY 18 has reported 49 percent growth in the adjusted earnings per share to $1.24, which has beaten the market estimates for the adjusted earnings per share of $1.08. The company had reported the adjusted revenue growth of 10 percent to $2.6 billion in the fourth quarter of FY 18, which has also beaten the estimates for revenue of $2.5 billion. EXPE’s fourth quarter GAAP net income was of the order of $17 million and this was below the GAAP net income of $55 million noted in the prior corresponding period. However, the adjusted EBITDA was up to $471 million from 2017 prior corresponding period levels ($402 million). The free cash flow had fallen by $38 million in 2018 to $1.10 billion, from $1.14 billion a year ago on the back of rise in capital expenditures incurred due to the Seattle headquarters, which was partly offset by increase in net cash provided by operating activities. During the fourth quarter, the company posted the gross bookings of $21.9 million, versus the market expectations of about $21.8 million. The gross bookings found support for Expedia Partner Solutions and Brand Expedia; and particularly, a 13% rise in the domestic gross bookings was seen with 8% rise in international gross bookings. For FY 18, the company reported 13% rise in gross bookings to nearly $100 billion. However, the company has posted slow growth in EXPE’s home rental service. In the fourth quarter 2018, the company has reported 20% rise in the revenue from HomeAway, which is although the slowest rate of the year 2018. Gross bookings at HomeAway grew 15% for Q4 2018 compared to 47 percent growth in the fourth quarter of 2017. The revenue from air rose 18% in the fourth quarter of 2018, as EXPE sold 10% more tickets and at 7% higher average prices. There was a 9% growth in total advertising and media revenue in the fourth quarter in view of growth in Expedia Group Media Solutions. However, the same was partly offset by trivago’s performance.
.png)
Financial Highlights (Source: Company Reports)
A rise of 10% was noted for Other Revenue given the performance of the travel insurance product; and even the total lodging revenue was up by 10% on the back of stayed room night growth of 11%. Across the Core OTA segment, the company has posted the growth in both lodging revenue and stayed room nights in line with the third quarter of 2018. Additionally, as at December 31, 2018, EXPE has cash, cash equivalents, restricted cash and short-term investments of $2.7 billion. For the year ended December 31, 2018, the company posted the consolidated net cash provided by operating activities of $2.0 billion, including the net changes in the operating assets and liabilities, majorly due to the rise in deferred merchant bookings. In addition, as of December 31, 2018, EXPE has exceeded the mark of 1 million properties, that is available on its core lodging platform that comprises more than 370,000 integrated HomeAway listings.
.png)
Key Ratios Over the Years (Source: Company Reports and Thomson Reuters)
Capital Management: In FY 18, the company has returned approximately $1.1 billion of capital to the shareholders, primarily through the share repurchases and the quarterly dividend. EXPE deployed about $186 million in the year 2018 and mostly this was related to acquisitions and other strategic investments. It also repurchased about 7.7 million shares for a price of about $903 million (excluding the transaction costs). Thereafter, EXPE reported to have about 12.2 million shares that were shown to be remaining under repurchase authorization of April 2018, as of December 31, 2018. Meanwhile, EXPE on December 6, 2018, had already paid the quarterly dividend of aggregate amount of $48 million, which represents $0.32 per common share. In February 2019, the group declared a quarterly cash dividend ($0.32 per share) that was paid on March 27, 2019 to stockholders of record as at March 07, 2019. Moreover, as at December 31, 2018, the company has long-term debt, of total $3.7 billion and a $2 billion unsecured revolving credit facility. Meanwhile, EXPE is taking extensive steps for the simplification of the company’s complex ownership structure and to increase the company’s valuation. Recently, the company had planned the acquisition of Liberty Expedia in a stock swap, to streamline and simplify EXPE’s voting structure which is divided between two 77-year-old billionaire media moguls, John Malone and Barry Diller, from a long time. The deal is still under discussion and consideration by the company.
.png)
Travel Platform (Source: Company Reports)
Future Outlook: For 2019, the company plans to invest substantially in HomeAway due to its strong growth prospects. This will comprise of the brand marketing for HomeAway and VRBO, building the groundwork to explore substantial opportunity present in urban and international opportunities, which will lead to the next level of growth for the business. The company aims to benefit from HomeAway such that the continued growth can be capitalized basis a long-term opportunity present in the alternative accommodation space. This is thus expected to boost top and bottom line growth in the long term. While the prevailing level of investment might slow down the adjusted EBITDA growth for HomeAway in 2019, the returns are expected to be realized over a time frame. On the other hand, for 2019, the company expects the total adjusted EBITDA growth to be in the range of 10% to 15%. The company further expects that the cycle of the adjusted EBITDA growth will follow the similar pattern to 2018 and therefore there will be pressure on adjusted EBITDA in the first quarter of 2019 and the large majority of growth is projected to come in the rest of the year. The first quarter is expected to witness some pressure as Easter will fully shift into the second quarter and thus there will be some impact on revenue and profit levels in the initial period. The cloud expenses have also been estimated to move up from $141 million in 2018 to about $250 million in 2019; and the company has projected FY19 adjusted EBITDA growth to be approximately 400 basis points higher, excluding these cloud expenses. Capex may range from $425 million to $475 million in 2019 and then to about $135 million to $185 million in 2020.
Boost from Industry Growth: The cruise travel industry is projected to witness growth in 2019 and EXPE CruiseShipCenters' growth is expected to be driven by the uptrend in demand. According to the Cruise Lines International Association (CLIA) report, over 30 million passengers might cruise in 2019 and this would be a humongous growth over the last five years. Moreover, the global travel market is estimated around $1.7 trillion for 2019, and therefore, there is a good opportunity for EXPE to grow.
.png)
Huge opportunity for EXPE in $1.7T global market (Source: Company Reports)
Stock Recommendation: EXPE stock is trading at a price of $119.80, with support at $108.5 level and resistance at $131.5. For 2019, the company expects the total adjusted EBITDA growth to be in the range of 10% to 15%, though there will be pressure on the first quarter. The industry has good growth potential, which EXPE can leverage on. The company has posted strong compounded growth in room nights, revenue and earnings in the past five years. The company’s business, to some extent, is based on technology advancement that is being tuned to customer requirements and spending. The strength from domestic market presence, travel opportunities across the globe, penetration in current markets, bolt-on acquisitions and a healthy cash flow position make EXPE a good investment theme over long term while high-end competition and legal issues do loom over the performance statistics. Nevertheless, the growth drivers tend to build up a case of Forward 24 months Earnings per share of high single digit and this with NTM (Next twelve months) Mean P/E of around low double digit (e.g.17x) is expected to give a high single digit to low double digit stock price upside. We give a “Buy” on the stock at the current price of $ 119.80.
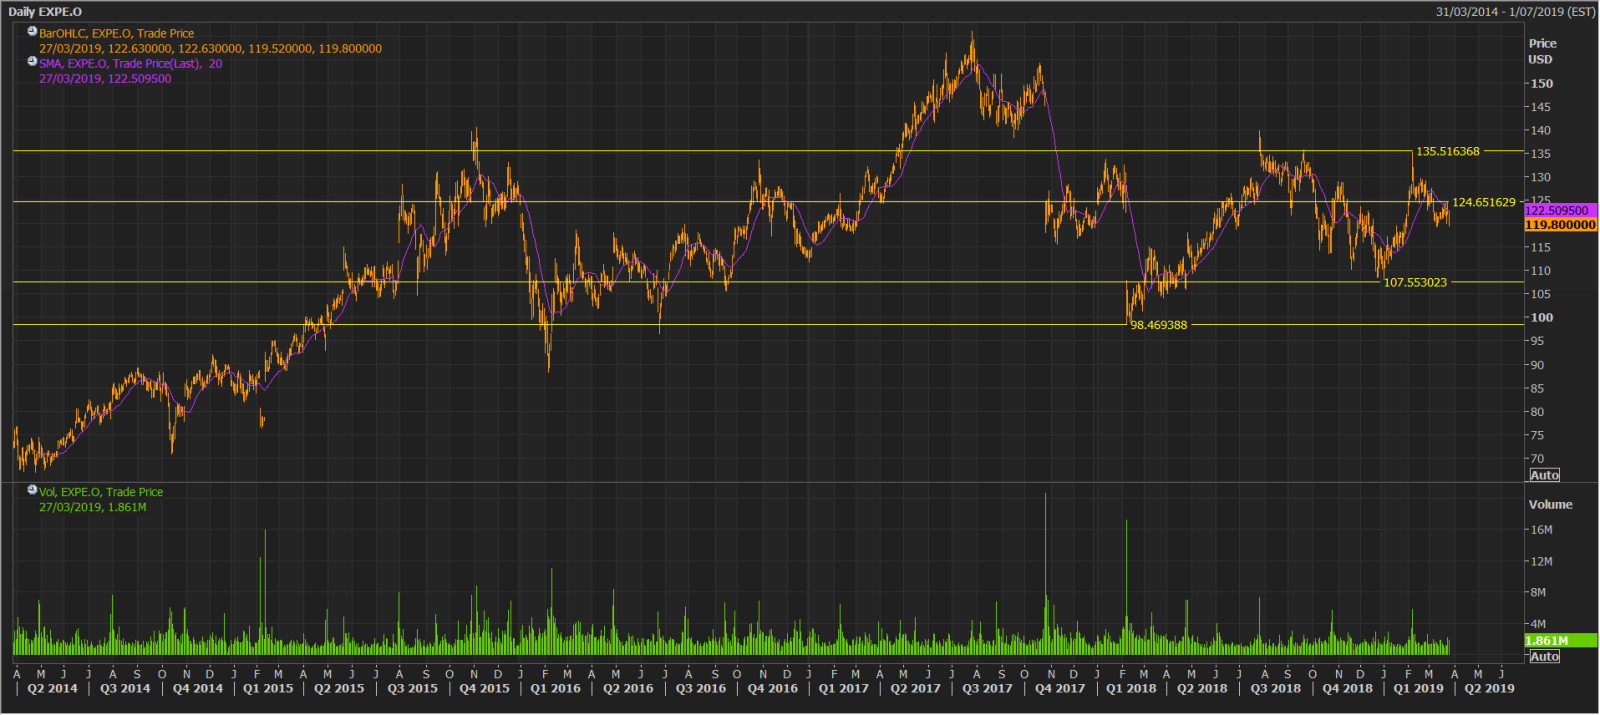
EXPE Daily Chart (Source: Thomson Reuters)
Disclaimer
The advice given by Kalkine Pty Ltd and provided on this website is general information only and it does not take into account your investment objectives, financial situation or needs. You should therefore consider whether the advice is appropriate to your investment objectives, financial situation and needs before acting upon it. You should seek advice from a financial adviser, stockbroker or other professional (including taxation and legal advice) as necessary before acting on any advice. Not all investments are appropriate for all people. Kalkine.com.au and associated websites are published by Kalkine Pty Ltd ABN 34 154 808 312 (Australian Financial Services License Number 425376). The information on this website has been prepared from a wide variety of sources, which Kalkine Pty Ltd, to the best of its knowledge and belief, considers accurate. You should make your own enquiries about any investments and we strongly suggest you seek advice before acting upon any recommendation. Kalkine Pty Ltd has made every effort to ensure the reliability of information contained in its newsletters and websites. All information represents our views at the date of publication and may change without notice. To the extent permitted by law, Kalkine Pty Ltd excludes all liability for any loss or damage arising from the use of this website and any information published (including any indirect or consequential loss, any data loss or data corruption). If the law prohibits this exclusion, Kalkine Pty Ltd hereby limits its liability, to the extent permitted by law to the resupply of services. There may be a product disclosure statement or other offer document for the securities and financial products we write about in Kalkine Reports. You should obtain a copy of the product disclosure statement or offer document before making any decision about whether to acquire the security or product. The link to our Terms & Conditions has been provided please go through them and also have a read of the Financial Services Guide. On the date of publishing this report (mentioned on the website), employees and/or associates of Kalkine Pty Ltd do not hold positions in any of the stocks covered on the website. These stocks can change any time and readers of the reports should not consider these stocks as advice or recommendations.
Past performance is not a reliable indicator of future performance.

 Please wait processing your request...