Company Overview: Levi Strauss & Co. is an apparel company. The Company designs, markets and sells its products under the Levi's, Dockers, Signature by Levi Strauss & Co. and Denizen brands directly or through third parties and licensees. Its products include jeans, casual and dress pants, tops, shorts, skirts, jackets, footwear, and related accessories for men, women and children across the world. The Company's trademarks include Arcuate Stitching Design, the Tab Device, 501, the Two Horse Design, the Housemark and the Wings and Anchor Design. The Company operates in three geographic segments: the Americas, Europe and Asia. The Company's products are sold in more than 110 countries. The Company licenses its Levi's and Dockers trademarks for a range of product categories in markets in each of its regions, including footwear, belts, wallets and bags, outerwear, sweaters, dress shirts, kidswear, sleepwear and hosiery.
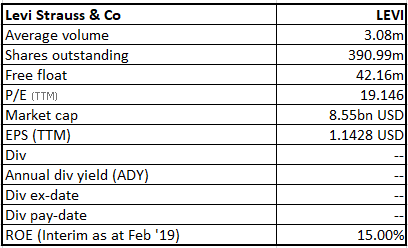
LEVI Details
Turnaround Financial Performance During First Quarter of FY19: Levi Strauss & Co. (NYSE: LEVI), a US based clothing company, has been known to sell its products in approximately 110 countries. The company is well known for the brand Levi’s and is a world leader in denim jeans. LEVI had come with an IPO for a second time on March 21st, 2019, and started trading at the price of $22.22 a share. The company came out with the initial public offering at a price of $17 per share; and interestingly, a significant rise in stock price was noted on the first day of listing. The company had opened 115 company-operated stores in 2018 and had closed 41 stores. As of February, the company was operating 832 stores that were company-operated ones across the continents - Americas, Europe and Asia. Meanwhile, during the first quarter of FY 19, Levi made a turnaround as it swung to a profit of $146.6 million from a loss of $19 million a year ago (this included a tax-related charge in a year ago period). For the first quarter of FY 19, the company has reported 81 percent growth in the adjusted net income primarily on the back of transition charge of $37 million levied in the prior year on undistributed foreign earnings, along with higher adjusted EBIT of $26 million in the current year. During the first quarter of FY 19, the company has posted 14 percent growth in the adjusted EBIT, and this includes the unfavorable currency translation effects and posted 21 percent growth on a constant currency basis, primarily driven by the total effect of the higher net revenues and costs like Selling, general and administrative (SG&A) costs. The company has reported 7% rise in the revenue to $1.44 billion from the corresponding period last year and posted 11% growth in revenue on a constant currency basis. The company’s net revenues grew due to 10% growth in the company's direct-to consumer business, which expanded on the back of the performance and growth of the retail network along with the growth in the e-commerce business. At the end of the first quarter of 2019, the company had added 70 company-operated stores compared to the corresponding period year prior. The company has posted rise in net revenues due to 5% rise in the company's wholesale business, which also reflects positive growth in all the regions.
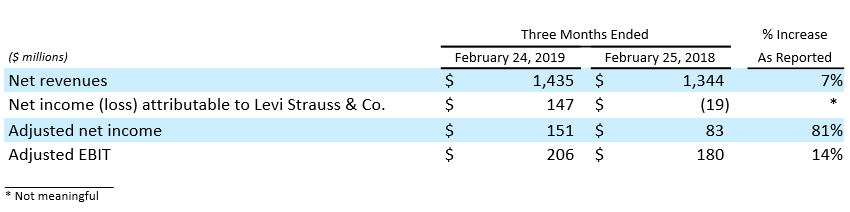
Performance (Source: Company Reports)
Maintaining gross margins despite a mix of scenario: For the first quarter of FY 19, on a reported basis, the company’s gross margin stood at 54.6 percent of net revenues against 54.9 percent noted for the same quarter of FY18. This is majorly on the back of the unfavorable transactional currency impact of 90 basis-points, which was partially offset due to the margin benefit that the company received from the expansion of the company's global direct-to-consumer channel. During the first quarter of FY 19, the company’s SG&A expenses rose to $582 million versus the $563 million in the corresponding quarter of fiscal 2018 driven by the rise and expansion of the company's direct-to-consumer business, which was however partially offset due to the positive impact of currency. The company has posted decline in the SG&A expenses as a percent of net revenues by 130 basis-points compared to the corresponding quarter last year, due to leverage on base costs and also due to low advertising on the back of the timing of the company's campaigns related with advertisements which was partially offset by the increase in direct-to-consumer costs. For Q1 of FY 19, a 15% growth in the operating income to about $201 million was noted against prior corresponding period given the revenue growth and a 100 basis-point expansion in group’s operating margin. Company’s cash and cash equivalents stood at $622 million, as at February 24, 2019; and it holds short-term investments of $100 million. The company has revolving credit facility of $806 million, which reflects the company’s total liquidity position of approximately $1.5 billion. A net debt of $319 million was noted at the end of the first quarter of 2019. The cash from operations stood at $56 million indicating a drop of $10 million compared to the corresponding period of fiscal 2018, given the rise in payments for employee incentive compensation due to strong performance of fiscal 2018. This was, however partially offset due to low contributions based on pension plan. For the first quarter of fiscal 2019, the company has posted the adjusted free cash flow of $17 million, which reflects an increase of $52 million compared to the first quarter of fiscal 2018. The timing of proceeds received from the settlement of forward foreign exchange contracts helped the increase in adjusted free cash flow, while decline in cash from operations and higher dividend payment by the company were also noted. The company for FY 19 had declared the dividend of $110 million, and the company paid half of it in the first quarter of 2019.
Reported Growth across core geographies: LEVI during the first quarter of FY 19, has posted positive growth across the core geographies like America, Europe & Asia. In the Americas, during the first quarter of FY 19, the company has reported 9% rise in the net revenues on reported basis and 10 percent growth on a constant-currency basis, which is on back of rise in the revenues due to both the wholesale and direct-to-consumer channels over the region. In the Americas, there was a 11% rise in operating income on a reported basis and 12% on a constant-currency basis. In Europe, the company has reported 3% growth in net revenues on a reported basis and 10 percent growth on a constant-currency basis, on the back of the continuous growth that is broad-based of the direct-to-consumer and wholesale channels. In Europe, 6% growth was noted in the operating income on a reported basis and 13% on a constant-currency basis; while in Asia, LEVI has reported 8% growth in the net revenues on a reported basis and 14% on a constant-currency basis. Primarily, robust performance of the traditional wholesale, franchisee, and direct to consumer channels had driven the performance. The company has posted broad-based revenue growth across Asia market, that includes China. In Asia, 6% rise in the operating income on a reported basis and 13% on a constant-currency basis, was also noted.
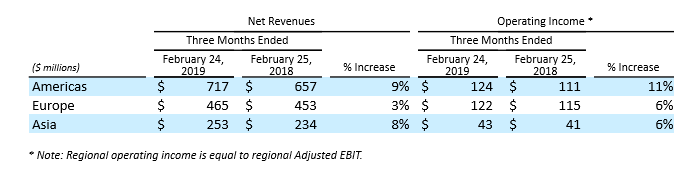
Regional Performance (Source: Company Reports)
Signed Global licensing agreement with Safilo: LEVI & Safilo, a worldwide leader in the design, manufacturing and distribution of eyewear, have signed the global licensing agreement for multi-year for the designing, manufacturing and distribution of Levi’s branded eyewear. This agreement as per the terms of the agreement will actually come into effect from January 2020, when the new collections of Levi’s branded eyewear will hit the market for the 2020 spring/summer season, and the agreement will run till November 2024. This contract can be renewed for an additional five-years, up to 2029. This move gives the group an opportunity to grow in the contemporary market segment, given the huge development potential while further development in key emerging markets, such as China is also targeted at. LEVI considers eyewear as an important product category for the company’s brand and expects that the partnership with Safilo will allow both the companies to strengthen their position further around the world.
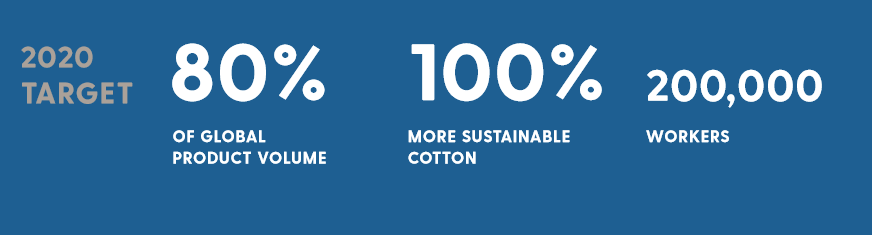
2020 Target projections as set in 2017 Annual Report (Source: Company Reports)
Outlook for FY 19: For fiscal 2019, the company has reaffirmed its outlook, and expects the net revenues at constant-currency to grow in mid-single digit for 2019. The company expects adjusted EBIT margin at constant-currency to be flat or to be up slightly. Given that the ending of the fiscal year 2019 will not include the benefit of Black Friday to the FY 19 results, the group will have to forgo a half-a-point of the annual net revenues and 25 basis-points as an addition to the adjusted EBIT margin. Additionally, for FY 19, the company projects the capital expenditure to be in the range of approximately $190 - $200 million and plans to open nearly 100 new company-operated stores in fiscal 2019, that include 16 new stores opened in the first quarter of FY 19.

Financial Ratios (Source: Company Reports and Thomson Reuters)
Stock Recommendation: LEVI for the first quarter of FY 19, has posted turnaround performance to profit from loss posted in the corresponding period last year. The company has also performed well across core geographies during the quarter. Moreover, LEVI plans to open 100 stores in FY 19 (already opened 16 stores during the first quarter of FY 19). The group’s gross margin, EBITDA margin and operating margin, as at February 2019, have been above respective industry medians. The return on equity has been much above the industry median, and the return on invested capital has also improved significantly. Therefore, investor demand through the IPO, history of decent performance and on-track earnings result for the latest quarter, penetration into new geographies with higher sales in regions like Asia, and aim to target China as the key growth driver seem to be working towards group’s next leg of success. Further, more is expected from the group’s direct-to-consumer model wherein the business has been growing well (double digits) with additional boost seen across e-commerce platform. Group’s strategy to highlight the ‘live in Levi's’ dictum is turning out pretty well. Given the catalysts at hand and current trading levels, we initiate a “Buy” recommendation on LEVI at the current price of $ 22.75.

LEVI Daily Chart (Source: Thomson Reuters)
Disclaimer
The advice given by Kalkine Pty Ltd and provided on this website is general information only and it does not take into account your investment objectives, financial situation or needs. You should therefore consider whether the advice is appropriate to your investment objectives, financial situation and needs before acting upon it. You should seek advice from a financial adviser, stockbroker or other professional (including taxation and legal advice) as necessary before acting on any advice. Not all investments are appropriate for all people. Kalkine.com.au and associated websites are published by Kalkine Pty Ltd ABN 34 154 808 312 (Australian Financial Services License Number 425376). The information on this website has been prepared from a wide variety of sources, which Kalkine Pty Ltd, to the best of its knowledge and belief, considers accurate. You should make your own enquiries about any investments and we strongly suggest you seek advice before acting upon any recommendation. Kalkine Pty Ltd has made every effort to ensure the reliability of information contained in its newsletters and websites. All information represents our views at the date of publication and may change without notice. To the extent permitted by law, Kalkine Pty Ltd excludes all liability for any loss or damage arising from the use of this website and any information published (including any indirect or consequential loss, any data loss or data corruption). If the law prohibits this exclusion, Kalkine Pty Ltd hereby limits its liability, to the extent permitted by law to the resupply of services. There may be a product disclosure statement or other offer document for the securities and financial products we write about in Kalkine Reports. You should obtain a copy of the product disclosure statement or offer document before making any decision about whether to acquire the security or product. The link to our Terms & Conditions has been provided please go through them and also have a read of the Financial Services Guide. On the date of publishing this report (mentioned on the website), employees and/or associates of Kalkine Pty Ltd do not hold positions in any of the stocks covered on the website. These stocks can change any time and readers of the reports should not consider these stocks as advice or recommendations.
Past performance is not a reliable indicator of future performance.

 Please wait processing your request...