Section1: Commodity Update:
Gold Outlook: Gold is a precious metal commonly used for investments and jewellery. Gold is among Canada's most valuable mined commodities, with a production value of $13.2 billion in 2022. Production of Gold in Canadian mines has been increasing steadily over the last decade. Production reached 204 tonnes of gold in 2022, which is 8% higher compared to the previous year and 55% higher compared to 2013. In Canada, majorly Gold mining coming from Ontario and Quebec that together accounted for 72% of gold production. The key drivers behind gold prices in 2024 are global economic uncertainties, inflation, outlook for Fed interest rate cuts and U.S. real yields. The structural bull case for gold remains intact, even as prices have risen sharply. Traditionally, a weaker U.S. dollar and lower U.S. interest rates increase the appeal of yellow metal.
Data Source: Government of Canada
Section 2: Company Overview and Fundamental Insights:
2.1 Company Overview:
Torex Gold Resources Inc (TSX: TXG) is an intermediate producer of gold and other precious metals, engaged in the exploration, development, and exploration of its wholly owned Morelos Gold Property. The property consists of 29,000 hectares in the Guerrero Gold Belt, located 180 kilometres southwest of Mexico City and approximately 50 kilometres southwest of Iguala. Kalkine’s Gold Report covers the Investment Highlights, Key Financial Metrics, Risks, Technical Analysis along with the Valuation, Target Price, and Recommendation on the stock.
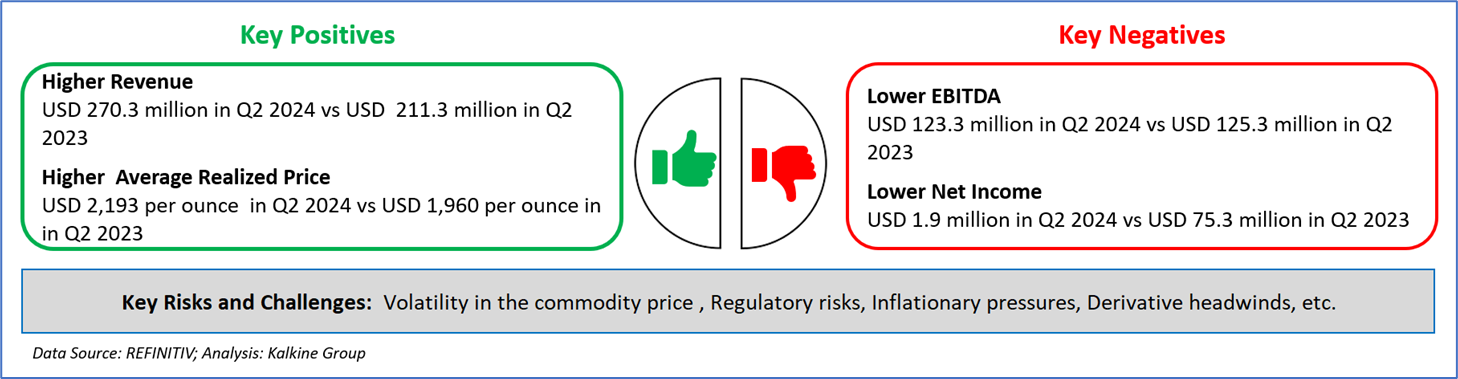
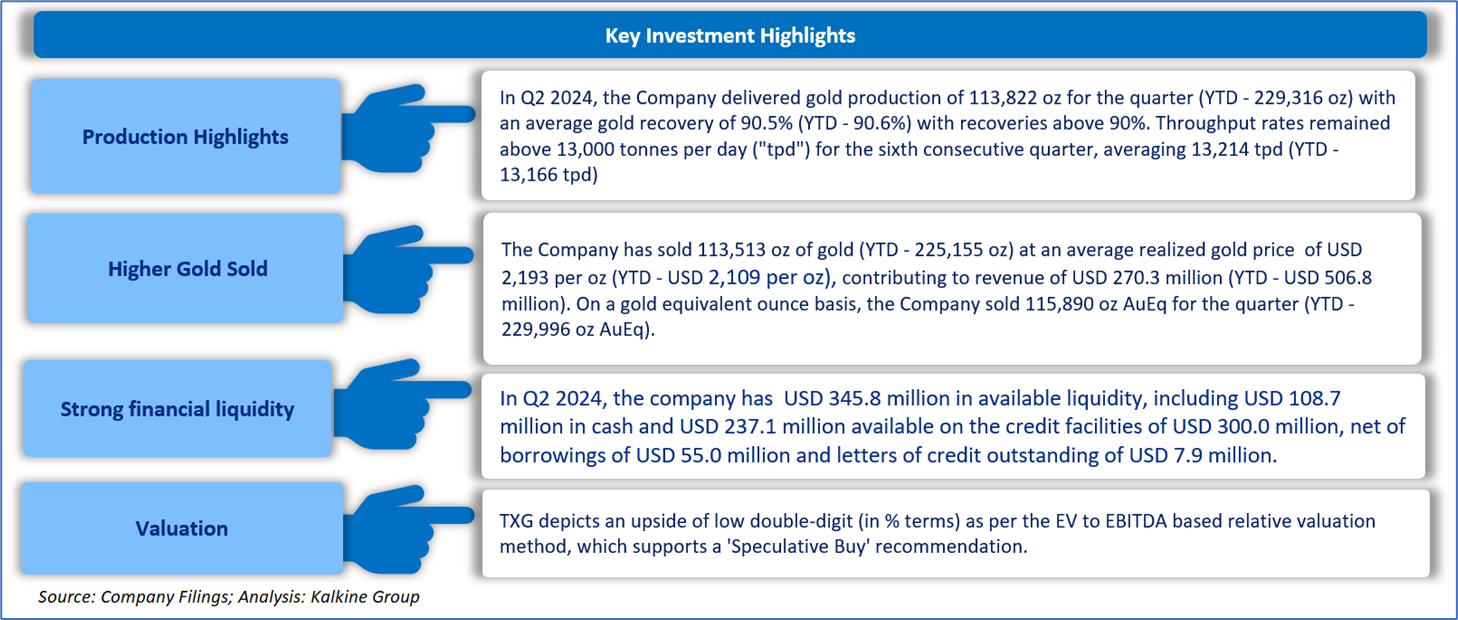
2.2 The Key Positives, Negatives, Investment Highlights and Risks
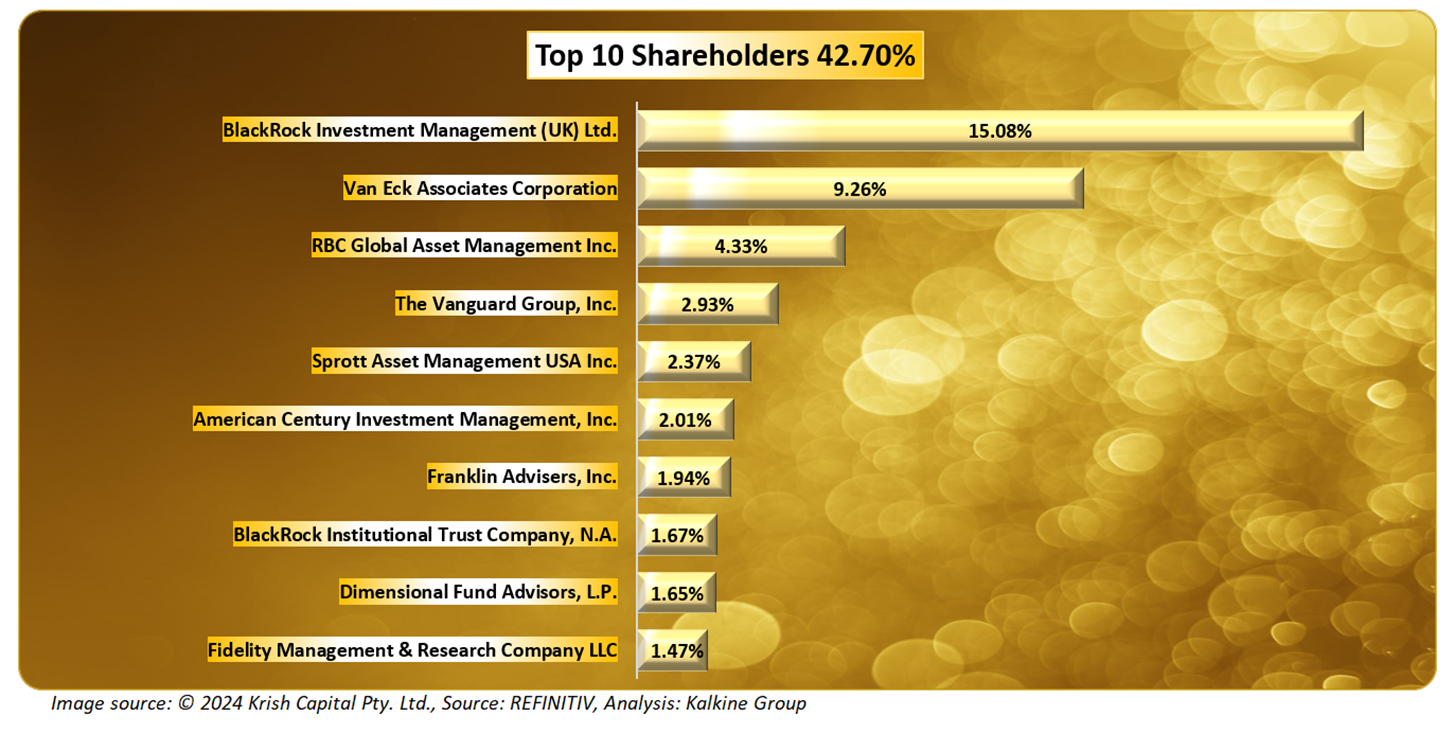
2.3 Top 10 Shareholders:
The top 10 shareholders together form ~42.70% of the total shareholding. BlackRock Investment Management (UK) Ltd. and Van Eck Associates Corporation hold a maximum stake in the company at ~15.08% and ~9.26%, respectively.
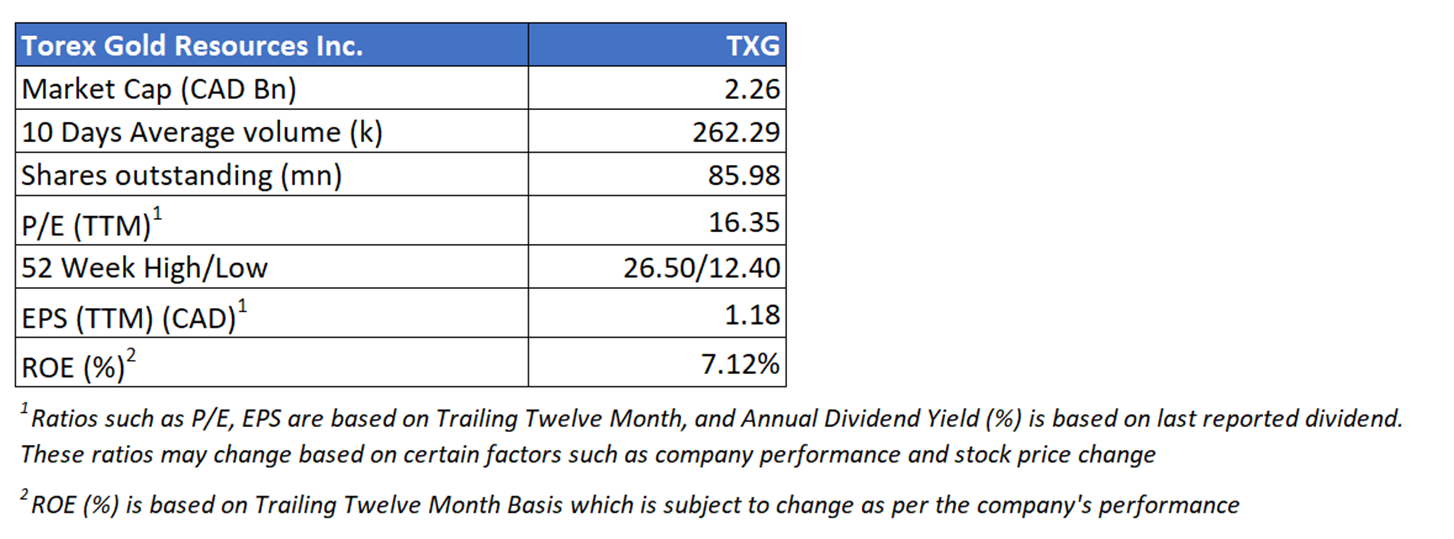
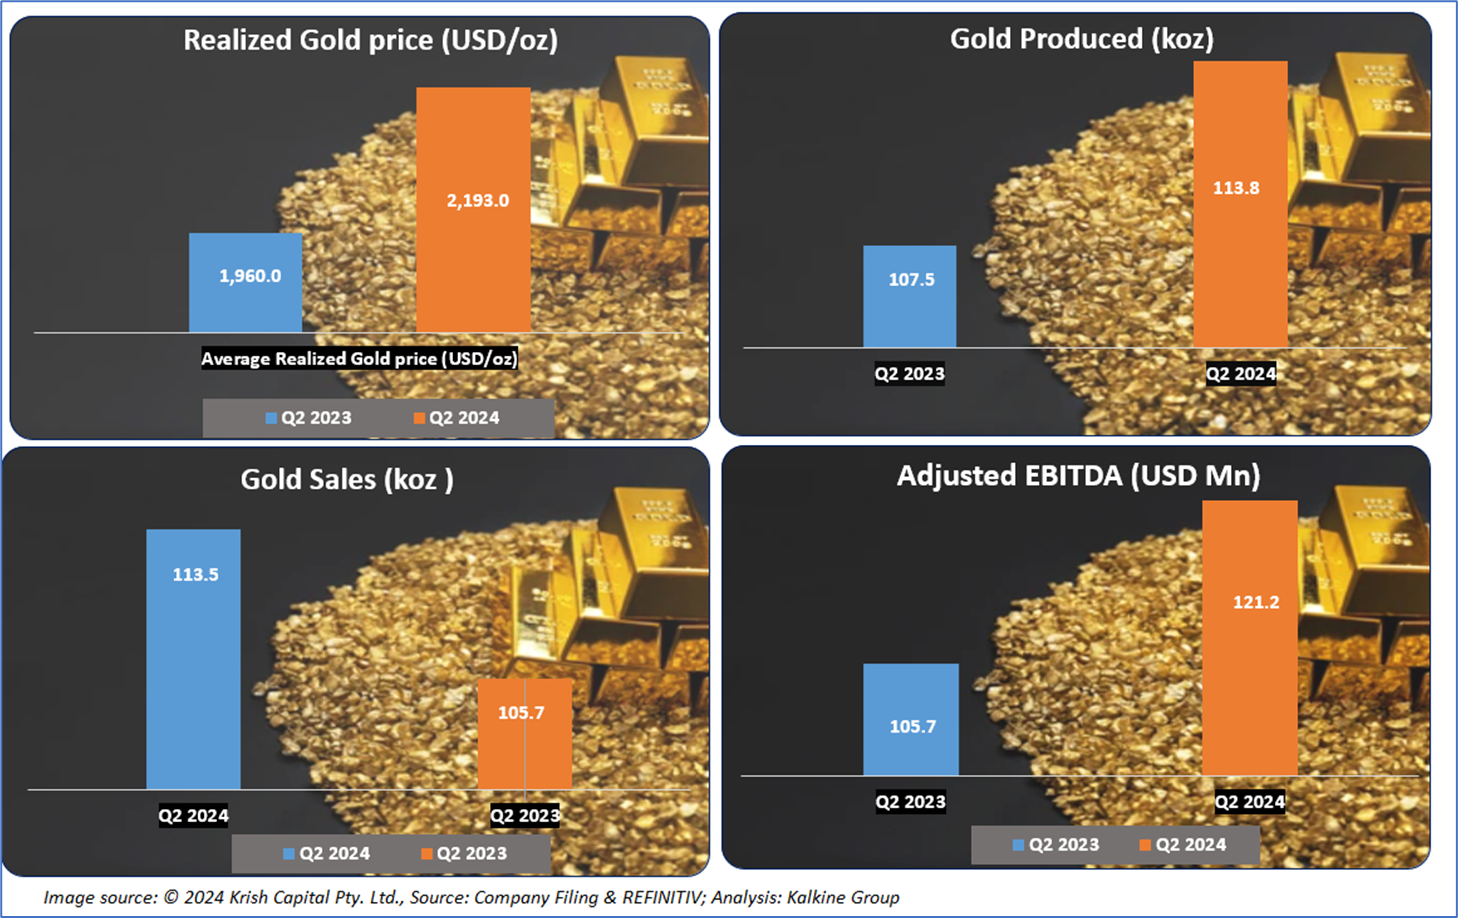
2.4 Key Metrics:
The firm has witnessed an improvement in its Gold Production and Gold Sales during the quarter. Further, the Adjusted EBITDA for the group has increased in the latest quarter, which is a significant positive that displays the company’s strength and adaptability.
Section 3: Business Updates and Financial Highlights
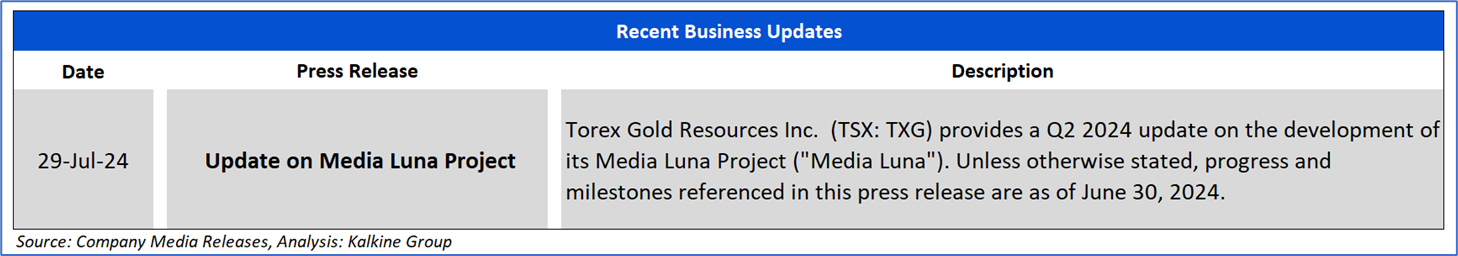
3.1 Recent Updates: The below picture gives an overview of its recent activities.
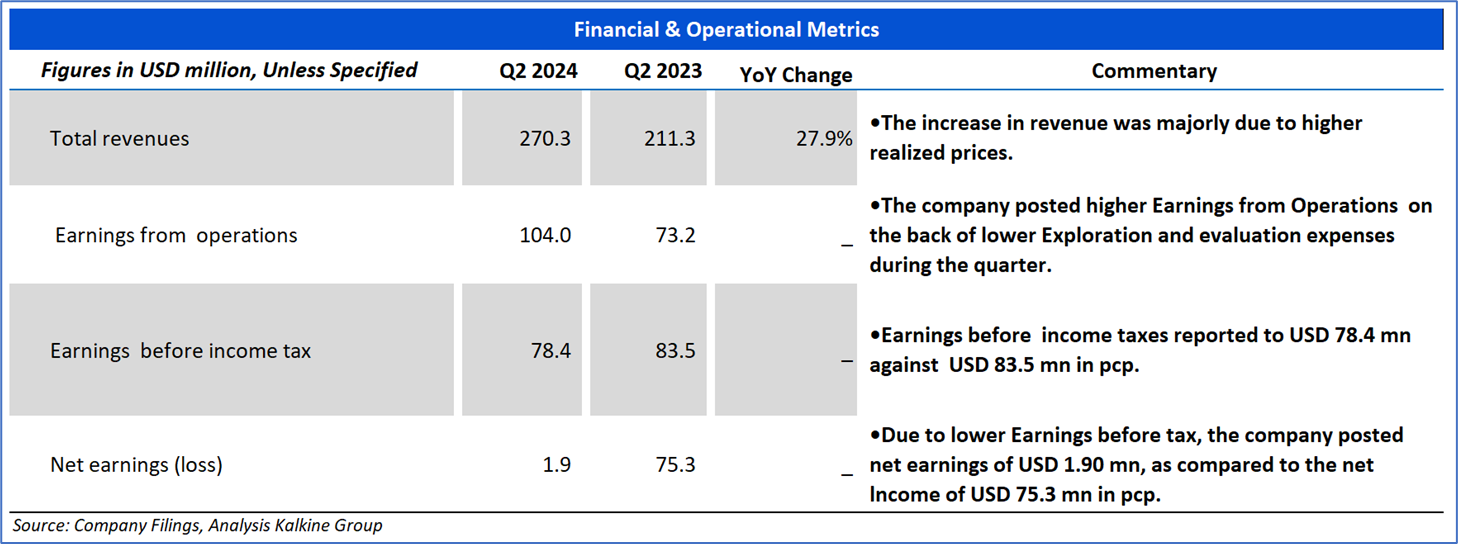
3.2 Insights on Q2 2024 Financial Performance:
Section 4: Key Risks and Company Outlook
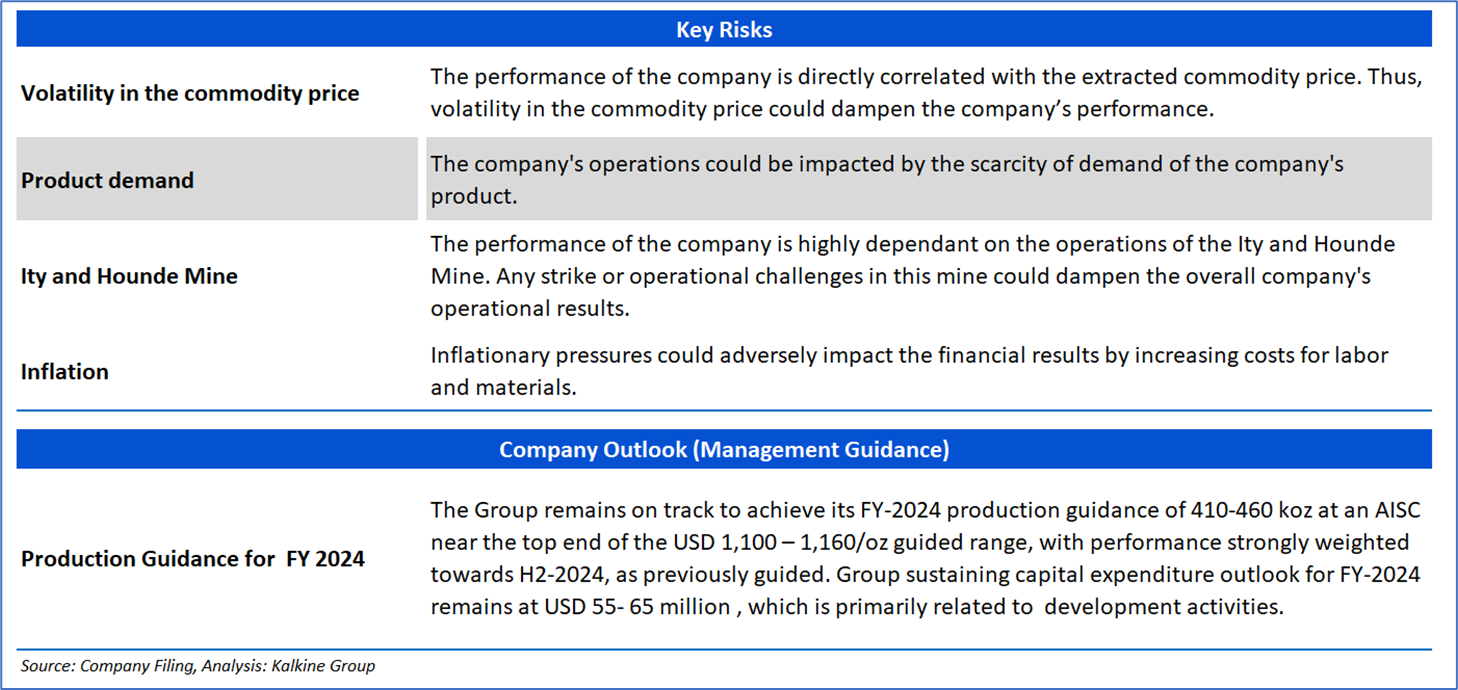
Section 4: Stock Recommendation Summary:
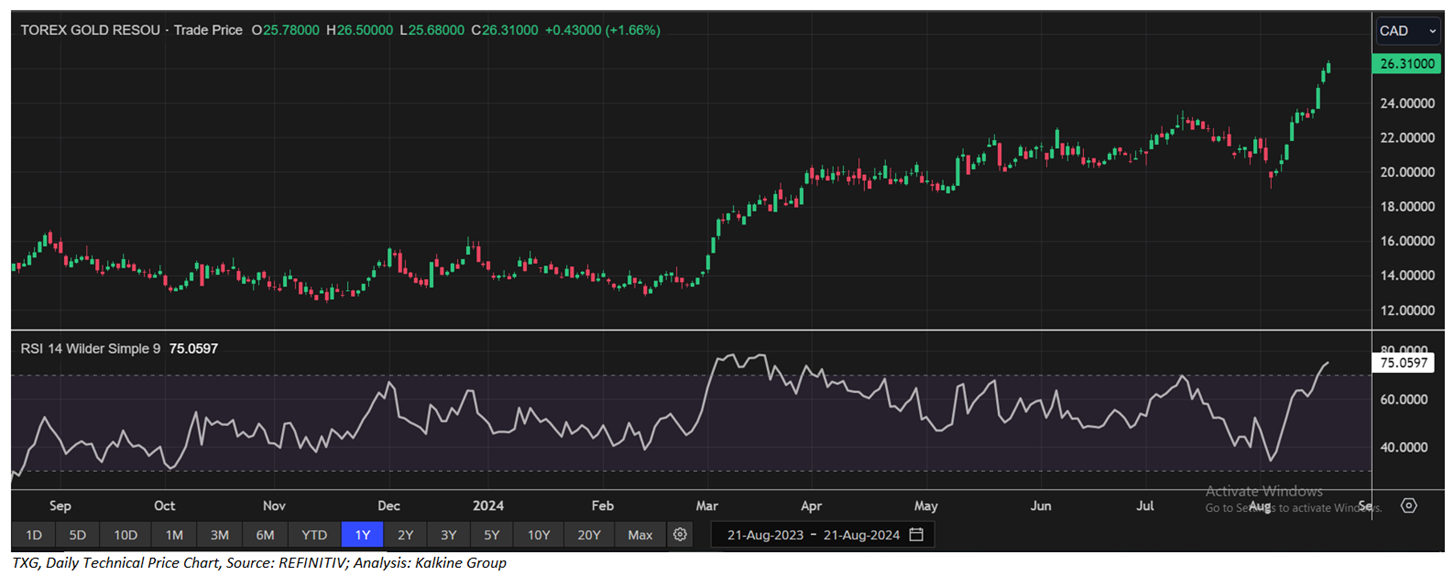
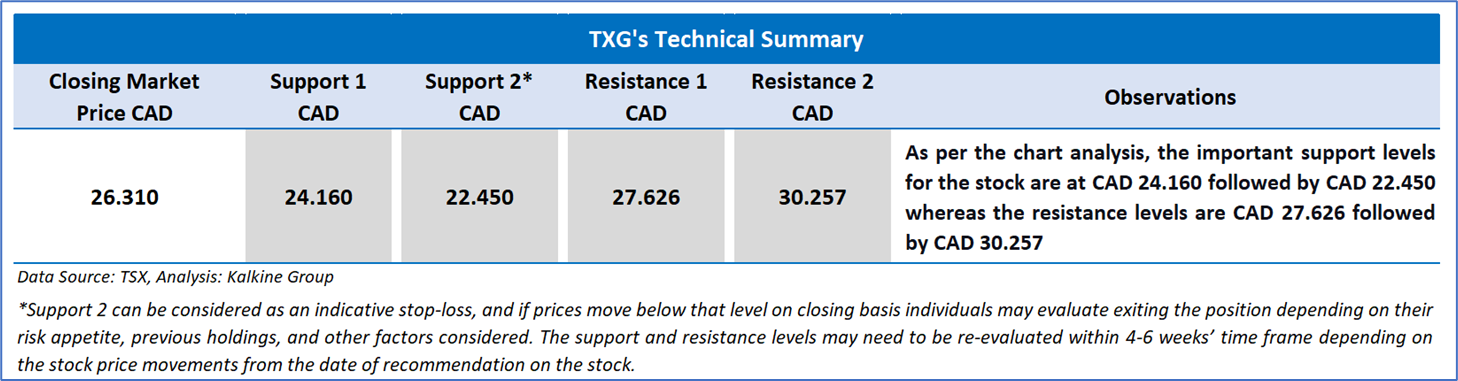
4.1 Price Performance and Technical Summary:

The stock has witnessed an upside of ~19.21% in 1 month and of ~28.78% over the last 3 months. Moreover, the stock is trading below the average 52-week high price of CAD 26.50 and 52-week low price of CAD 12.40 providing an opportunity to accumulate the stock.
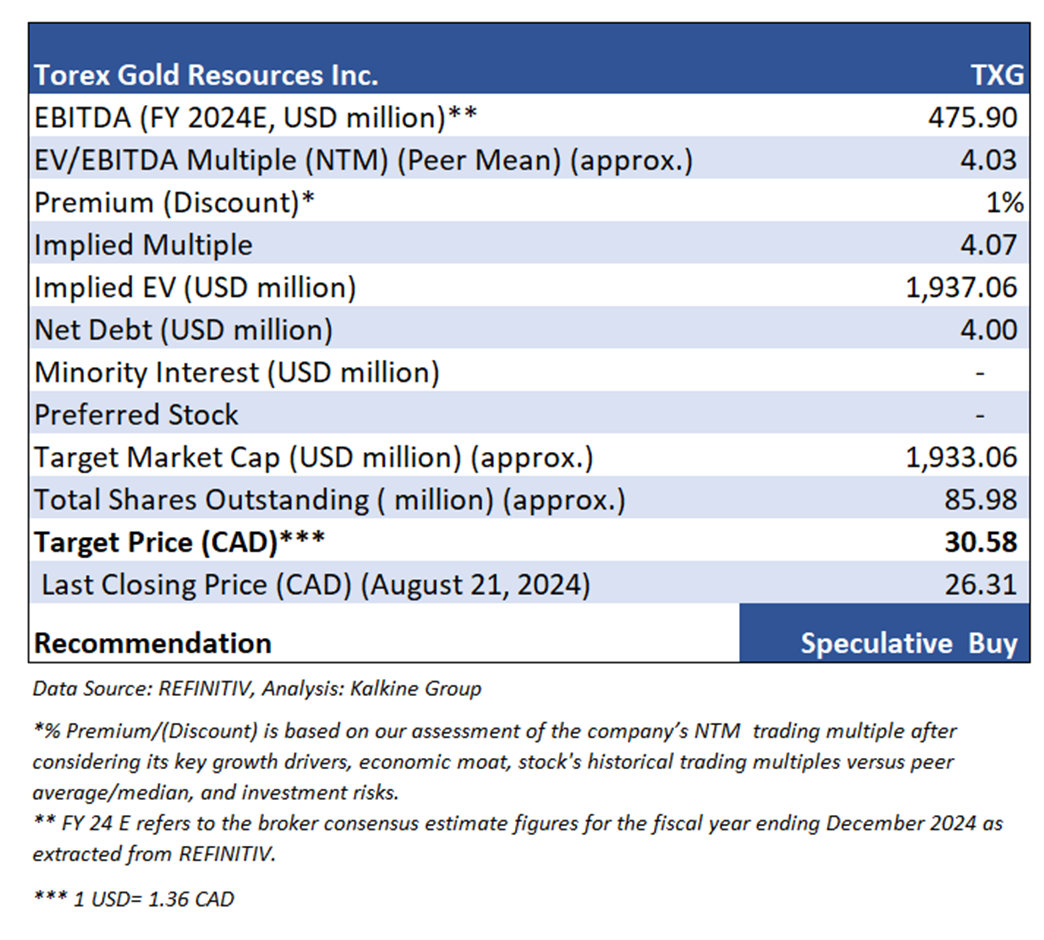
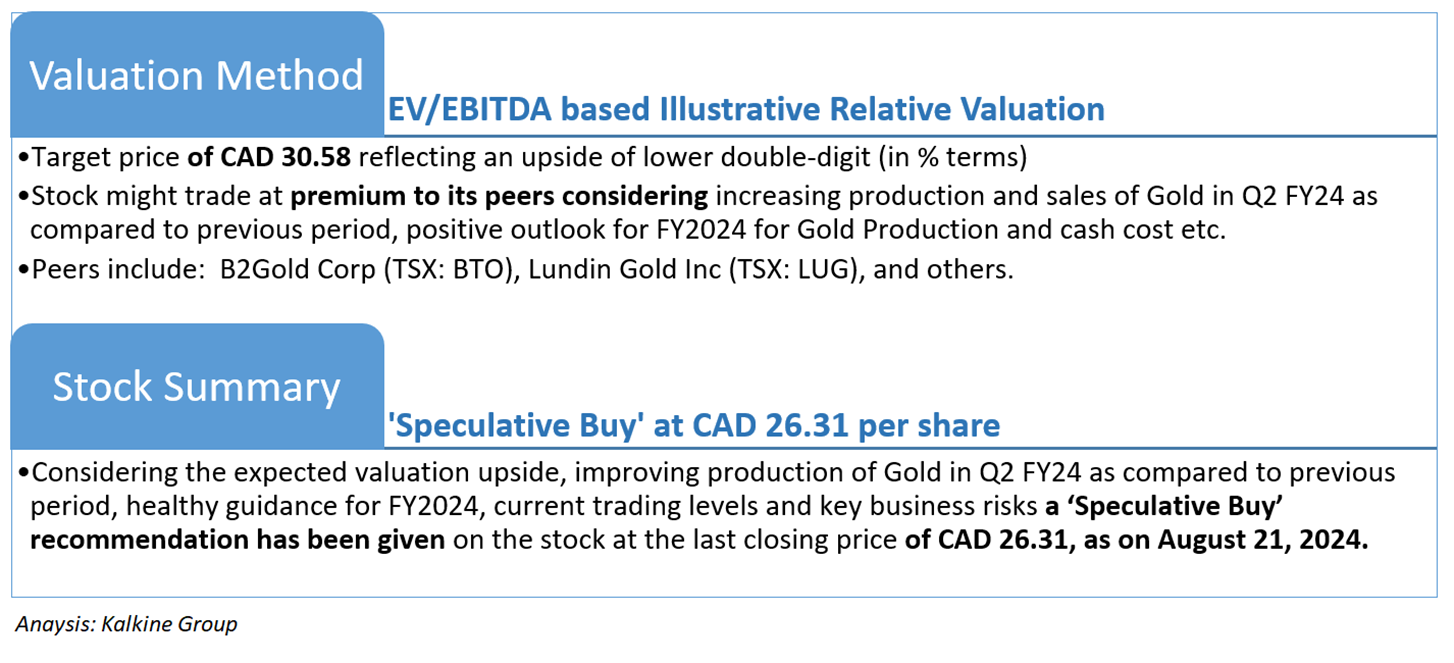
4.2 Fundamental Valuation
Valuation Methodology: EV to EBITDA Multiple Based Relative Valuation (Illustrative)
Markets are trading in a highly volatile zone currently due to certain macroeconomic issues and geopolitical tensions prevailing. Therefore, it is prudent to follow a cautious approach while investing.
Note 1: Past performance is not a reliable indicator of future performance.
Note 2: The reference date for all price data, currency, technical indicators, support, and resistance levels is August 21, 2024. The reference data in this report has been partly sourced from REFINITIV.
Note 3: Investment decisions should be made depending on an individual's appetite for upside potential, risks, holding duration, and any previous holdings. An 'Exit' from the stock can be considered if the Target Price mentioned as per the Valuation and or the technical levels provided has been achieved and is subject to the factors discussed above.
Note 4: Dividend Yield may vary as per the stock price movement.
Technical Indicators Defined: -
Support: A level at which the stock prices tend to find support if they are falling, and a downtrend may take a pause backed by demand or buying interest. Support 1 refers to the nearby support level for the stock and if the price breaches the level, then Support 2 may act as the crucial support level for the stock.
Resistance: A level at which the stock prices tend to find resistance when they are rising, and an uptrend may take a pause due to profit booking or selling interest. Resistance 1 refers to the nearby resistance level for the stock and if the price surpasses the level, then Resistance 2 may act as the crucial resistance level for the stock.
Stop-loss: It is a level to protect further losses in case of unfavourable movement in the stock prices.
The advice given by Kalkine Canada Advisory Services Inc. and provided on this website is general information only and it does not take into account your investment objectives, financial situation and the particular needs of any particular person. You should therefore consider whether the advice is appropriate to your investment objectives, financial situation and needs before acting upon it. You should seek advice from a financial adviser, stockbroker or other professional (including taxation and legal advice) as necessary before acting on any advice. Not all investments are appropriate for all people. The website www.kalkine.ca is published by Kalkine Canada Advisory Services Inc. The link to our Terms & Conditions has been provided please go through them. On the date of publishing this report (mentioned on the website), employees and/or associates of Kalkine do not hold positions in any of the stocks covered on the website. These stocks can change any time and readers of the reports should not consider these stocks as advice or recommendations later.
 Please wait processing your request...