Section1: Commodity Update:
Gold prices continued their decline on May 7, 2025, falling to around USD 3,360 per ounce, as expectations of sustained high U.S. interest rates weakened demand for the non-yielding asset. The Federal Reserve, as anticipated, left its key rate unchanged and highlighted growing concerns about inflation and unemployment, underscoring its cautious approach to future rate decisions. Fed Chair Jerome Powell clarified that the central bank is not contemplating a proactive rate cut in response to potential economic impacts from tariffs. At the same time, ongoing uncertainty over US-China trade negotiations helped prevent a steeper drop in gold prices.
Data Source: Trading Economics
Section2: Company Overview and Fundamental Insights:
2.1 Company Overview:
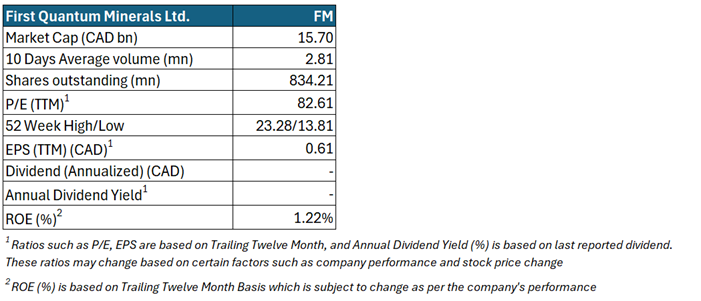
First Quantum Minerals Ltd. (TSX: FM) is a diversified mining company. The company's principal activities include mineral exploration, mine engineering and construction, and development and mining operations. The firm produces copper in concentrate, copper anode, copper cathode, nickel, gold, zinc, silver, acid, and pyrite. It has operating mines located in Zambia, Finland, Turkey, Spain, and Mauritania. The firm's project comprises Guelb Moghrein, Sentinel, Kansanshi, Cobre Panama, Pyhasalmi, Ravensthorpe, among others. Substantial revenue is generated from Cobre Panama.
Kalkine’s Gold Report covers the Investment Highlights, Key Financial Metrics, Risks, Technical Analysis along with the Valuation, Target Price, and Recommendation on the stock.
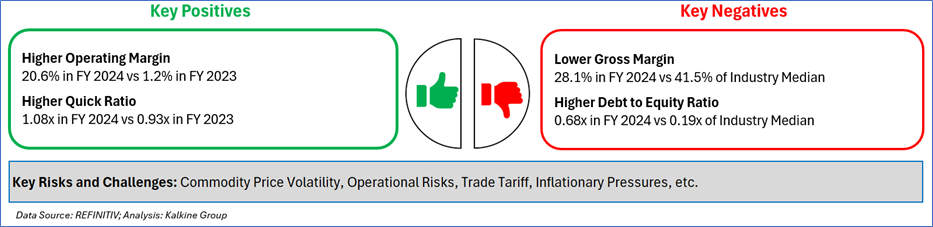
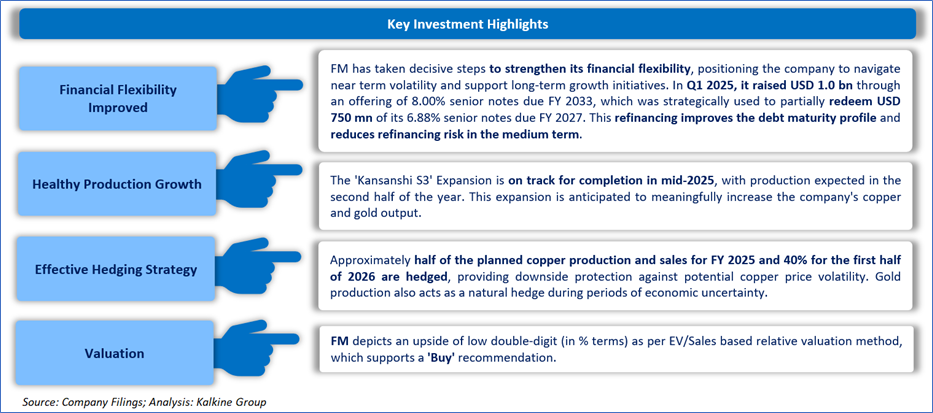
2.2 The Key Positives, Negatives, Investment Highlights and Risks
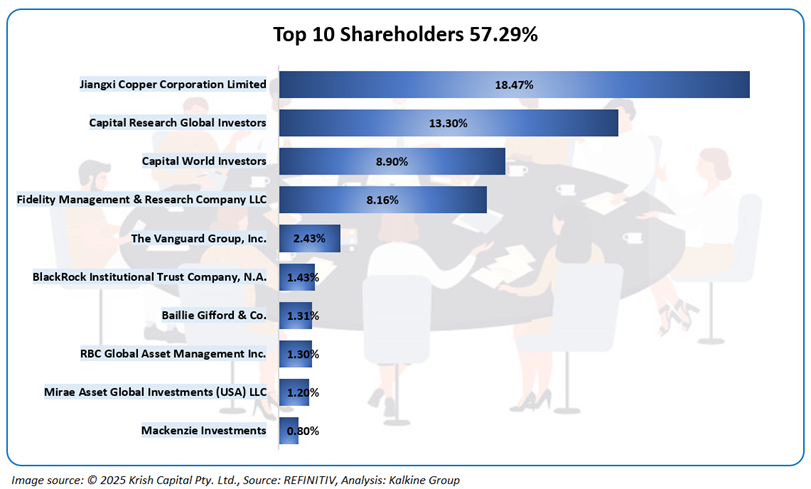
2.3 Top 10 Shareholders:
The top ten shareholders own around 57.29% of the total holdings. Jiangxi Copper Corporation Limited and Capital Research Global Investors have a maximum ownership in the company of around 18.47% and 13.30%, respectively.
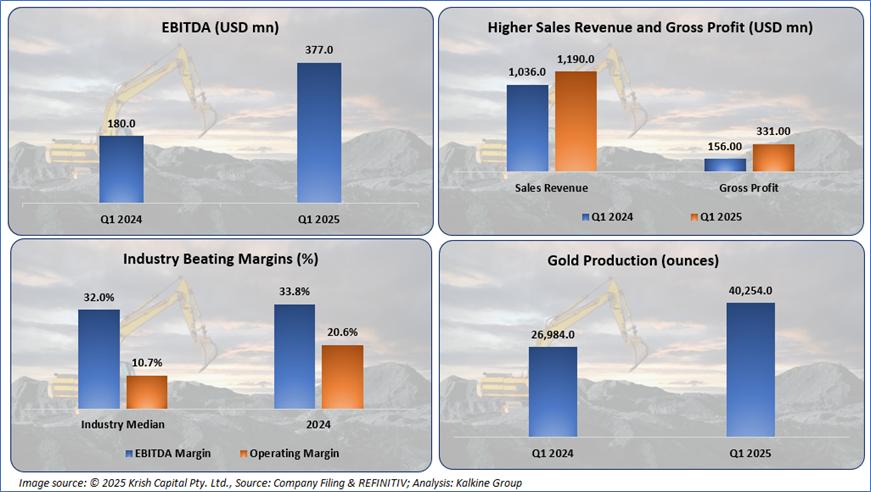
2.4 Key Metrics:
The company has consistently recorded strong financial results, which demonstrates its proven business model. The improvement in financial data was solely due to an increase in the Sales Revenue and EBITDA. Furthermore, the company has increased its gold production, which is further increasing its overall revenue.
Section 3: Business Updates and Financial Highlights
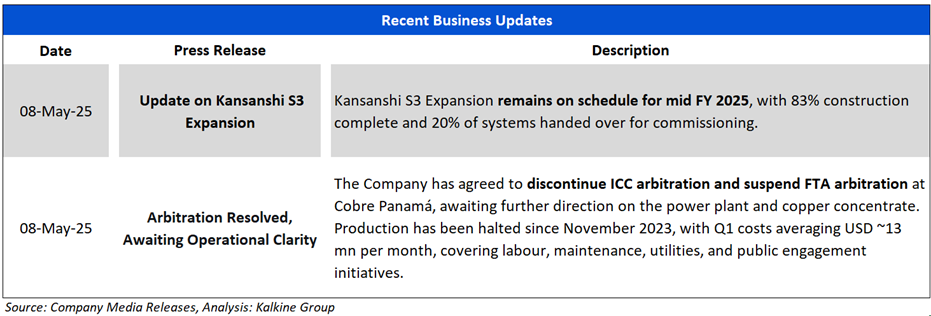
3.1 Recent Updates: The picture below gives an overview of the company’s recent activity on Kansanshi S3 Expansion and Production at Cobre Panamá.
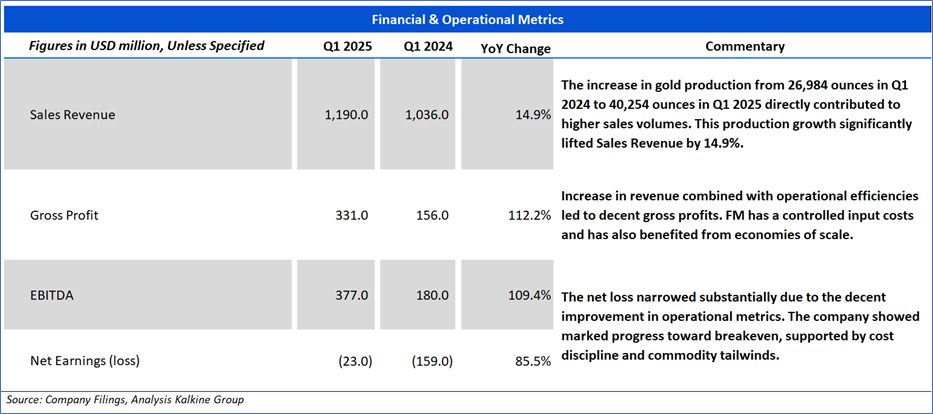
3.2 Insights on Q1 FY25 Financial Performance:
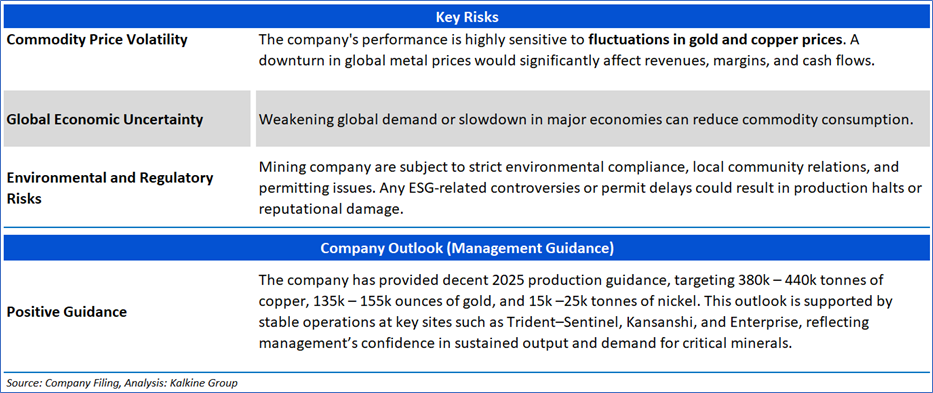
Section 4: Key Risks and Company Outlook
Section 5: Stock Recommendation Summary:
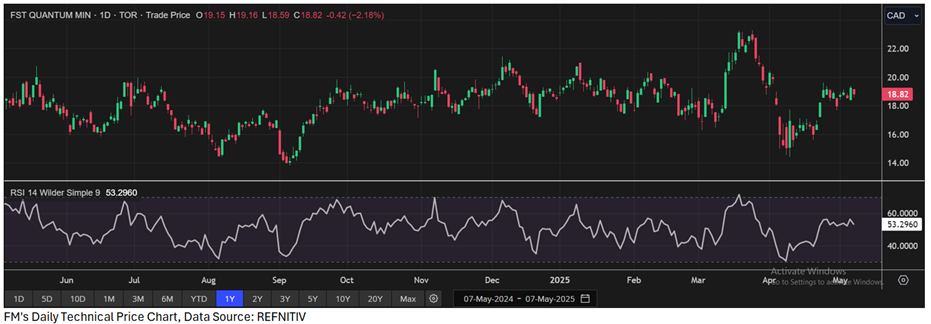
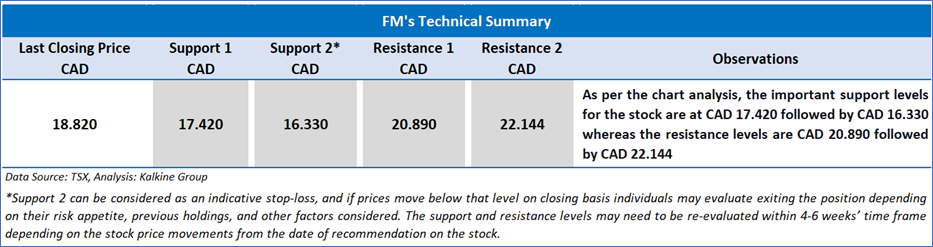
5.1 Price Performance and Technical Summary:

The stock has witnessed an upside of ~1.67% and a downside of ~1.93% over the last 1 week and 3 months respectively. Moreover, the stock is trading above the average 52-week high price of CAD 23.28 and a 52-week low price of CAD 13.81, providing an opportunity to ride the trend.
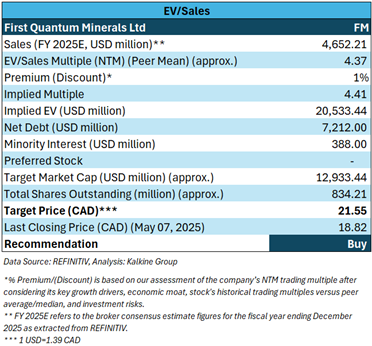
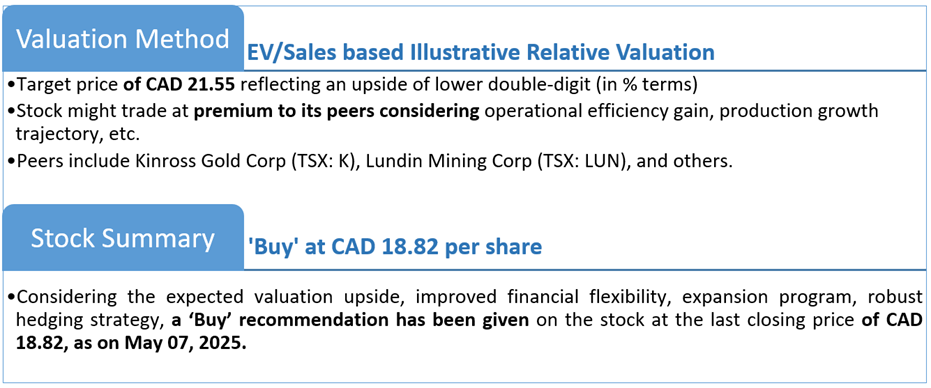
5.2 Fundamental Valuation
Valuation Methodology: EV to Sales Multiple Based Relative Valuation (Illustrative)
Markets are trading in a highly volatile zone currently due to certain macroeconomic issues and geopolitical tensions prevailing. Therefore, it is prudent to follow a cautious approach while investing.
Note 1: Past performance is not a reliable indicator of future performance.
Note 2: The reference date for all price data, currency, technical indicators, support, and resistance levels is May 7, 2025. The reference data in this report has been partly sourced from REFINITIV.
Note 3: Investment decisions should be made depending on an individual's appetite for upside potential, risks, holding duration, and any previous holdings. An 'Exit' from the stock can be considered if the Target Price mentioned as per the Valuation and or the technical levels provided has been achieved and is subject to the factors discussed above.
Note 4: Dividend Yield may vary as per the stock price movement.
Note 5: Kalkine reports are prepared based on the stock prices captured either from REFINITIV or Trading View. Typically, REFINITIV or Trading View may reflect stock prices with a delay which could be a lag of 25-30 minutes. There can be no assurance that future results or events will be consistent with the information provided in the report. The information is subject to change without any prior notice.
Technical Indicators Defined: -
Support: A level at which the stock prices tend to find support if they are falling, and a downtrend may take a pause backed by demand or buying interest. Support 1 refers to the nearby support level for the stock and if the price breaches the level, then Support 2 may act as the crucial support level for the stock.
Resistance: A level at which the stock prices tend to find resistance when they are rising, and an uptrend may take a pause due to profit booking or selling interest. Resistance 1 refers to the nearby resistance level for the stock and if the price surpasses the level, then Resistance 2 may act as the crucial resistance level for the stock.
Stop-loss: It is a level to protect further losses in case of unfavourable movement in the stock prices.
Past performance is not a reliable indicator of future performance.
 Please wait processing your request...