By: Team Kalkine | Dec 16, 2024 | Read Time : 10 Mins
Image Souce: Krish Capital Pty Ltd
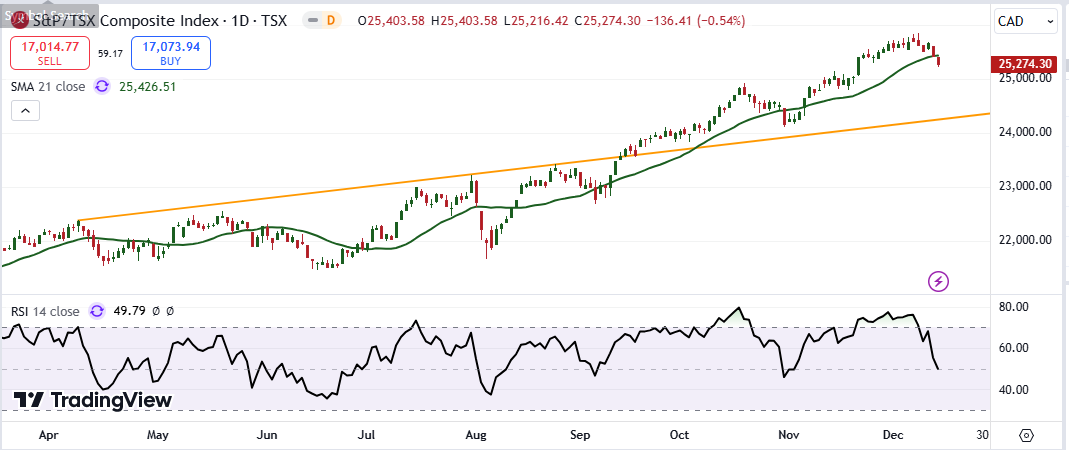
Index Update: The Canadian market closed weak on Friday, amid concerns about global economic growth and tariff hike threats by U.S. President-elect Donald Trump. The benchmark S&P/TSX Composite Index, which opened slightly down, fell to a low of 25,216.42 and ended the day's session at 25,274.30 with a loss of 136.41 points or 0.54%. The index shed about 1.6% in the week.
Macro Update: On the economic front, data from Statistics Canada showed manufacturing sales in the country rose 2.1% month-over-month in October, rising for the first time in three months.
Wholesale sales in Canada rose 1% month-over-month in October, extending the revised 1.3% increase in September.
Top Movers: Transcontinental Inc. (TCL.B.TO) rallied 4.4%. Bausch + Lomb Corporation (BLCO.TO), Bombardier Inc (BBD.B.TO), Hut 8 Corp (HUT.TO), Transcontinental (TCL.A.TO), Senvest Capital (SEC.TO), Descartes Systems Group (DSG.TO), Celestica Inc (CLS.TO), Great-West Lifeco (GWO.TO) and Loblaw Companies (L.TO) gained 1 to 3.5%.
Our Stance: The immediate support for the index is at 25,000, a level that could act as a buffer against further declines. If the index manages to hold above this level, a potential rebound could materialize, especially if there is stabilization in sectors like energy. However, a break below 25,000 could open the door for a deeper pullback, with support zones identified at 25,000 and 24,900. These levels will be critical for traders looking to assess the health of the market and the likelihood of a continuation or reversal of the current trend.
Commodity Update: The U.S. dollar remained near a three-week high against major currencies on Monday, amid expectations that the Federal Reserve will cut interest rates this week but signal a gradual easing pace for 2025. Bitcoin surged past $105,000 for the first time, fueled by reports that President-elect Donald Trump may proceed with a strategic Bitcoin reserve. In commodities, gold slipped 0.15% to $2,671.70 per ounce, silver gained 0.05% to $31.04 per ounce, and copper fell 0.15% to $9,048.50 per ton. Oil prices were subdued, with Brent crude down 0.30% to $74.28, as markets awaited the Federal Reserve's policy decision and assessed Chinese economic data.
Technical Update: On Friday, the S&P/TSX Composite Index closed at 25,274.30, marking a 0.54% decline for the day. This drop was largely driven by weakness in the industrials sector, which fell 1.74%, and contributed significantly to the broader market pullback. Despite this, the index remains above its 50-period Simple Moving Average (SMA), signaling that the short-term uptrend is still in place. However, there are signs that momentum may be slowing. The Relative Strength Index (RSI) dropped to 49.79, which indicates that bullish momentum is losing steam. Key technical levels are now in focus as the market navigates this uncertainty. The immediate support for the index is at 25,000, a level that could act as a buffer against further declines. If the index manages to hold above this level, a potential rebound could materialize, especially if there is stabilization in sectors like energy. However, a break below 25,000 could open the door for a deeper pullback, with support zones identified at 25,000 and 24,900. These levels will be critical for traders looking to assess the health of the market and the likelihood of a continuation or reversal of the current trend.
Disclaimer-
This article has been prepared by Kalkine Pty Limited (ABN 34 154 808 312) (Australian
financial services licence number 425376) (“Kalkine”) and its related bodies corporate authorised to
provide general financial product advice. Kalkine.com.au and associated pages are published by Kalkine.
Any information/advice provided in this article is general in nature and does not take into account your
objectives, financial situation or needs. You should therefore consider whether the information is
appropriate to your objectives, financial situation and needs before acting upon it. There may be a Product
Disclosure Statement, Information Statement or other offer document for the securities or other financial
products referred to in Kalkine articles. You should obtain a copy of the relevant Product Disclosure
Statement, Information Statement or offer document and consider the statement or document before
making any decision about whether to acquire the security or product. Please note past performance is
neither an indicator nor a guarantee of future performance.
You should also seek advice from a financial adviser, stockbroker or other professional (including
taxation and legal advice) as necessary before acting on any advice/information in this article or on the
Kalkine website. Not all investments are appropriate for all people.
The information in this article and on Kalkine website has been prepared from a wide variety of sources,
which Kalkine, to the best of its knowledge and belief, considers accurate. Kalkine has made every effort
to ensure the reliability of information contained in its articles, newsletters and websites.
All information represents our views at the date of publication and may change without notice. Kalkine
does not guarantee the performance of, or returns on, any investment. To the extent permitted by law,
Kalkine excludes all liability for any loss or damage arising from the use of this article, the Kalkine
website and any information published on the Kalkine website (including any indirect or consequential
loss, any data loss or data corruption). If the law prohibits this exclusion, Kalkine hereby limits its
liability, to the extent permitted by law.
Please also read our Terms & Conditions and Financial Services Guide for further information. On the
date of publishing this article (referred to on the Kalkine website), employees and/or associates of Kalkine
and its related entities do not hold interests in any of the securities or other financial products covered on
the Kalkine website unless those persons comply with certain safeguards, procedures, and disclosures.
Some of the images/music that may be used in the article are copyright to their respective owner(s).
Kalkine does not claim ownership of any of the pictures displayed/music used in the article unless stated
otherwise. The images/music that may be used in the article are taken from various sources on the
internet, including paid subscriptions or are believed to be in public domain. We have used reasonable
efforts to accredit the source wherever it was indicated or was found to be necessary.
Kalkine Media Pty Ltd, an affiliate of Kalkine Pty Ltd, may have received, or be entitled to receive,
financial consideration in connection with providing information about certain entity(s) covered on its
website.

 Please wait processing your request...