RY 156.45 0.5851% SHOP 111.75 -0.4986% TD 80.54 1.4997% ENB 59.44 -0.5688% BN 66.08 1.2565% TRI 233.31 0.734% CNQ 37.01 -2.1934% CP 97.64 -0.041% CNR 132.86 -1.5852% BMO 126.97 1.0666% BNS 64.59 1.7486% CSU 4382.2002 0.8562% CM 79.39 1.405% MFC 39.02 -0.128% ATD 69.45 1.0476% NGT 65.33 2.2699% TRP 64.55 -0.8905% SU 46.26 -1.8668% WCN 266.71 1.3644% L 201.02 1.2746%

TSX Climbs to New Record High

By: Team Kalkine | Nov 22, 2024 | Read Time : 10 Mins
TSX Climbs to New Record High

Image Souce: Krish Capital Pty Ltd

Index Update:  The benchmark S&P/TSX Composite Index, which climbed to a new record high of 25,402.06, ended the session with a gain of 354.22 points or 1.41% at 25,390.68.

Macro Update: The Canadian government unveiled a mini stimulus package. The measures announced by the government will cost the Canadian treasury an estimated 6.3 billion Canadian dollars, and include a temporary, two-month sales-tax exemption on certain goods and services. Furthermore, the Liberal government will issue a onetime tax-free cash transfer of C$250 to individuals who earn less than C$150,000 Canadian dollars a year.

Data from Statistics Canada showed industrial producer prices in Canada rose by 1.2% month-over-month in October, rebounding from a revised 0.8% decline in the previous month. On a yearly basis, producer prices rose by 1.1% in October, after a revised 1% fall in the previous month.

Top Movers: Dayforce Inc (DAY.TO), Tourmaline Oil Corp (TOU.TO), AtkinsRealis Group (ATRL.TO), Magna International (MG.TO), Constellation Software (CSU.TO), Royal Bank of Canada (RY.TO), TFI International (TFII.TO), Shopify Inc (SHOP.TO), Metro Inc (MRU.TO), Stantec Inc (STN.TO), Canadian Pacific Kansas City (CP.TO), Canadian National Railway (CNR.TO), West Fraser Timber (WFG.TO) and Dollarama (DOL.TO) climbed 2 to 3.7%.

Our Stance: A dip below 24,700 could trigger a retracement risk, with the 24,200 to 24,000 range serving as important support on the weekly chart. As long as these support levels hold, the broader market sentiment remains positive, and there's potential for further growth. However, a breach of these levels would raise concerns about a potential pullback, urging caution for the near term. Overall, the outlook is constructive, with key levels to watch closely for signs of trend continuation or reversal.

Commodity Update: The U.S. dollar remained near a 13-month high on Friday as investors weighed the Federal Reserve's future interest rate decisions, while European uncertainty kept the euro under pressure. Bitcoin approached the $100,000 mark, attracting investor attention. In commodities, gold rose 0.63% to $2,691.50 per ounce, silver gained 0.35% to $31.05, and copper edged up 0.12% to $9,043.50 per ton. Meanwhile, Brent crude climbed 0.20% to $74.37 per barrel after Russia launched a ballistic missile at Ukraine and hinted at an expanding conflict, raising concerns over potential disruptions in global oil supplies.

undefined

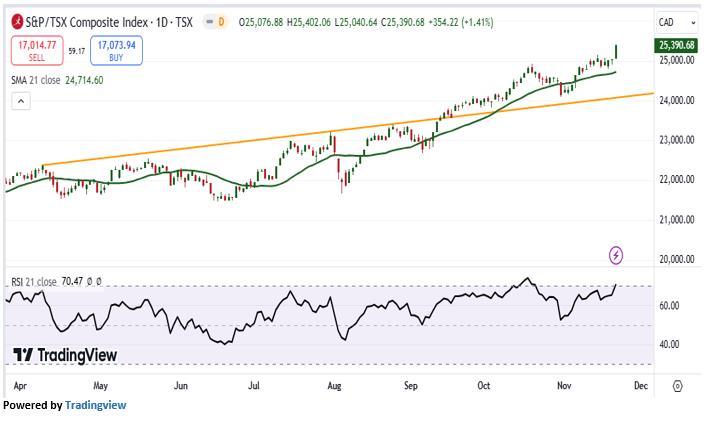
Technical Update: The S&P/TSX Composite Index showed strong performance on Thursday, advancing by 354.22 points (up 1.41%) to close at 25,390.68, bolstered by robust trading volumes that reflect ongoing investor optimism. A notable highlight was the technology sector, which led the rally, gaining 2.19%, suggesting heightened confidence in tech stocks. From a technical perspective, the index remains on solid footing, comfortably above its 21-period Simple Moving Average (SMA), reinforcing a bullish trend. The Relative Strength Index (RSI) of 70.47 indicates healthy momentum without nearing overbought territory, leaving potential room for further gains. The index is now testing a key support level around 24,700, which will be critical in determining the next phase of the market. Holding above this level is vital to sustaining the current bullish momentum. A dip below 24,700 could trigger a retracement risk, with the 24,200 to 24,000 range serving as important support on the weekly chart. As long as these support levels are held, the broader market sentiment remains positive, and there's potential for further growth. However, a breach of these levels would raise concerns about a potential pullback, urging caution for the near term. Overall, the outlook is constructive, with key levels to watch closely for signs of trend continuation or reversal.


Disclaimer- This article has been prepared by Kalkine Pty Limited (ABN 34 154 808 312) (Australian financial services licence number 425376) (“Kalkine”) and its related bodies corporate authorised to provide general financial product advice. Kalkine.com.au and associated pages are published by Kalkine. Any information/advice provided in this article is general in nature and does not take into account your objectives, financial situation or needs. You should therefore consider whether the information is appropriate to your objectives, financial situation and needs before acting upon it. There may be a Product Disclosure Statement, Information Statement or other offer document for the securities or other financial products referred to in Kalkine articles. You should obtain a copy of the relevant Product Disclosure Statement, Information Statement or offer document and consider the statement or document before making any decision about whether to acquire the security or product. Please note past performance is neither an indicator nor a guarantee of future performance. You should also seek advice from a financial adviser, stockbroker or other professional (including taxation and legal advice) as necessary before acting on any advice/information in this article or on the Kalkine website. Not all investments are appropriate for all people. The information in this article and on Kalkine website has been prepared from a wide variety of sources, which Kalkine, to the best of its knowledge and belief, considers accurate. Kalkine has made every effort to ensure the reliability of information contained in its articles, newsletters and websites. All information represents our views at the date of publication and may change without notice. Kalkine does not guarantee the performance of, or returns on, any investment. To the extent permitted by law, Kalkine excludes all liability for any loss or damage arising from the use of this article, the Kalkine website and any information published on the Kalkine website (including any indirect or consequential loss, any data loss or data corruption). If the law prohibits this exclusion, Kalkine hereby limits its liability, to the extent permitted by law. Please also read our Terms & Conditions and Financial Services Guide for further information. On the date of publishing this article (referred to on the Kalkine website), employees and/or associates of Kalkine and its related entities do not hold interests in any of the securities or other financial products covered on the Kalkine website unless those persons comply with certain safeguards, procedures, and disclosures. Some of the images/music that may be used in the article are copyright to their respective owner(s). Kalkine does not claim ownership of any of the pictures displayed/music used in the article unless stated otherwise. The images/music that may be used in the article are taken from various sources on the internet, including paid subscriptions or are believed to be in public domain. We have used reasonable efforts to accredit the source wherever it was indicated or was found to be necessary. Kalkine Media Pty Ltd, an affiliate of Kalkine Pty Ltd, may have received, or be entitled to receive, financial consideration in connection with providing information about certain entity(s) covered on its website.