
Company Overview: ConocoPhillips is an independent exploration and production company. The Company explores for, produces, transports and markets crude oil, bitumen, natural gas, liquefied natural gas (LNG) and natural gas liquids. The Company operates through six segments: Alaska, Lower 48, Canada, Europe and North Africa, Asia Pacific and Middle East, and Other International. The Alaska segment explores for, produces, transports and markets crude oil, natural gas liquids, natural gas and LNG. The Lower 48 segment consists of operations located in the United States Lower 48 states and the Gulf of Mexico. Its Canadian operations consists of oil sands developments in the Athabasca Region of northeastern Alberta. The Europe and North Africa segment consists of operations and exploration activities in Norway and Libya. The Asia Pacific and Middle East segment has exploration and production operations in China, Indonesia, Malaysia and Australia.
(25).png)
COP Details
Integrated Strategies to Strengthen Balance Sheet Further: ConocoPhillips (NYSE: COP) is the world’s largest independent exploration and production (E&P) company, based on proved reserves and production of liquids and natural gas. The company explores, produces, markets and distributes crude oil, bitumen, natural gas, LNG and natural gas liquids across major countries in the world. The company has operating facilities in the United States, Norway, the United Kingdom, Canada, Australia, Timor-Leste, Indonesia, Malaysia, Libya, China and Qatar. Over the period of FY15-FY18, the company has posted a CAGR growth of 7.2% in revenue. FY18 proved to be a remarkable year for COP as bottom-line turned into a profit of $6,305 million in FY18 from a loss of $4,371 million in FY15. Looking at the recent few quarters, COP delivered consistent, strong operational and financial performances, which also demonstrate the company’s unwavering commitment to financial returns, capital discipline, free cash flow generation and returning capital to shareholders.
The company recently chalked out a ten-year plan for the period 2020 – 2029, which reaffirms its disciplined approach and returns-focused strategy that was announced in 2016. The company highlighted a multi-year outlook that comprises low cost of supply resource base, a disciplined and diversified value-based investment approach, a robust scenario-based strategy framework to create value through substantial free cash flow generation.
Going forward, COP firmly believes that the business is set to deliver a sustainable, distinctive and compelling value proposition that is highly competitive not only within the energy sector but also across the broader market. The company has targeted free cash flow of $50 billion for FY20-29, with an average free cash flow breakeven price of ~$35/BBL. As per the management guidance, the business is likely to deliver production growth of >3% CAGR with <$7B annual average capital over the period of 2020-2029.
.png)
Financial Snapshot over the period FY15-FY18 (Source: Company Reports)
Revenue Recognition: Revenues associated with the sales of crude oil, bitumen, natural gas, liquified natural gas (LNG), natural gas liquids and other items are recognized at the point in time when the customer obtains control of the asset.
Q3FY19 Operating Highlights for the period ending 30 September 2019: COP announced its third quarter FY19 financial results, wherein the company reported total revenue and other income at $10,093 million as compared to $10,165 million in the previous corresponding period. The company reported net income at $3,071 million as compared to $1,873 million on account of lower income tax provision.
.jpg)
Q3FY19 Income Statement (Source: Company Reports)
Purchased commodities for the quarter came in at $2,710 million from $3,530 million in Q3FY18, primarily due to lower crude oil and natural gas prices. Production and operating expenses during the quarter stood at $1,331 million as compared to $1367 million. Exploration expenses during Q3FY19 increased $257 million from Q3FY18, primarily due to higher leasehold impairment and dry hole costs in the Lower 48 segment. During Q3FY19, the company recorded a $141 million before-tax leasehold impairment expense on account of discontinuation of exploration activities in the Central Louisiana Austin Chalk trend. Dry hole costs in the Lower 48 increased by approximately $120 million before-tax in the third quarter, which is also related to the above discontinued operation. Depreciation, depletion and amortization during Q3FY19 increased 6% on y-o-y basis to $1,566 Mn, respectively, mainly due to higher production volumes in the Lower 48 and Alaska, partly offset by lower expense in Europe and North Africa segment due to the cessation of DD&A for disposed U.K. assets.
During Q3FY19, the business reported total production at 1,322 thousand barrels of oil equivalent per day (MBOED), excluding Libya segment, depicting an increase of 98 MBOED increase over the same period a year ago. Underlying production, which excludes Libya and the net volume impact from closed dispositions and acquisitions of 58 MBOED in 2019 and 43 MBOED in 2018, increased 83 MBOED compared with the third quarter of 2018.
Product-wise Bifurcation: As per the product-wise bifurcation, majority of the production (~76.4%) is derived from the natural gas segment. Income from this product came in at 2,871 MMCFD in 3QF19, posting a growth of 5.09% on y-o-y basis. Crude oil segment contributed 18.89% to the total production, registering a growth of 11.81% on pcp to 710 MBD. Natural gas liquids and Bitumen reported production of 114 MBD and 63 MBD, respectively, representing a year-on-year growth of 3.03% and 1.68%, respectively.
.png)
Q3FY19 Production Bifurcation and Average Sales Price (Source: Company Reports)
Recent Updates: During the quarter, COP repurchased $0.75 billion of shares during the year. The business completed the acquisition of the previously announced Alaska Nuna discovered resource at a price consideration of ~$0.1 billion.
COP announced its Australia-West divestiture agreement for $1.4 billion, including customary closing adjustments, subject to the regulatory and other approvals. During the quarter, the company increased production from the Lower 48 Big 3 unconventionals by 21% on y-o-y basis.
Business Scenario: The price of Brent crude oil stood at an average of $61.94 per barrel during Q3FY19, witnessed a decline of 18% and 10% compared with $75.27 per barrel in the Q3FY18, and $68.82 per barrel in the second quarter of 2019, respectively. During Q3FY19, WTI average price of Crude oil came in at $56.44 per barrel, a decline of 19% y-o-y basis and 10% q-o-q basis on account of lower macro-economic demand across the globe.
The prices of Henry Hub natural gas were averaged at $2.23 per MMBTU during Q3FY19, reporting a decline of 23% on y-o-y basis and 16% from Q2FY19. The decline was primarily due to the seasonally mild weather reducing demand and growing U.S. natural gas production.
The business reported lower bitumen prices at $32.54 per barrel in Q3FY19, declined from $34.15 in 3QFY18, due to lower WTI benchmark price, which was partly offset by improvements in the WCS differential to WTI at Hardisty and lower diluent costs. The company’s total average realized price came in at $47.07 per BOE during the third quarter of FY19 as compared with $57.71 per BOE in the 3QFY18, aided by lower realized oil, natural gas and NGL prices.
Key Risks: The business prospects, including its revenues, operating results and future growth, are highly co-related with the prices, the business receives for its products. Lower price for crude oil, bitumen, natural gas, natural gas liquids and LNG may have a material adverse effect on the revenues, operating income, cash flows and liquidity. A decline in prices may also limit the amount of reserves the company can produce economically, adversely affecting the proved reserves and reserve replacement ratio, and accelerating the reduction in the existing reserve levels as COP continues production from upstream fields.
Top 10 Shareholders: The top 10 shareholders have been highlighted in the table, which together form around 27.81% of the total shareholding. The Vanguard Group, Inc. and State Street Global Advisors (US) hold the maximum interests in the company at 8.15% and 4.63%, respectively.
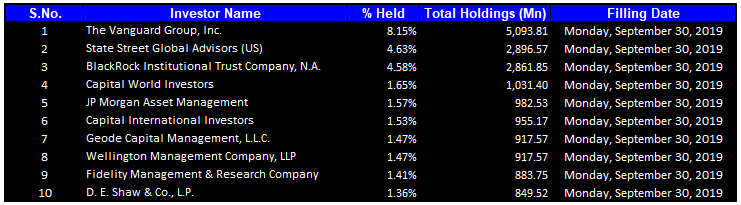
Top 10 Shareholders (Source: Thomson Reuters)
Key Metrics: The Company posted decent margins during the third quarter of FY19. Net margin for Q3FY19 stood at 39.6%, higher than the industry median of 6.2% and Q3FY18 of 19.1%. Operating margin for Q3FY19 came in at 41.0%, higher than the industry median of 15.6%. Return on Equity (ROE) during the quarter stood at 9.0%, higher than the industry median of 1.7%.
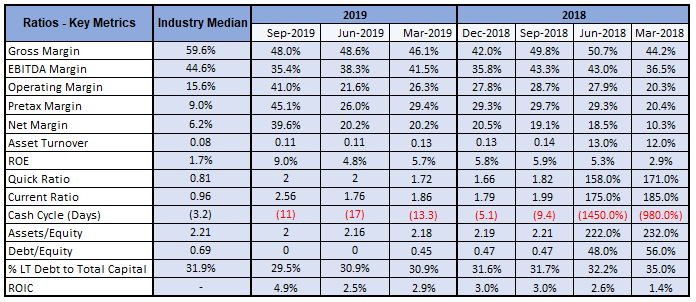
Key Ratios Metrics (Source: Thomson Reuters)
Guidance: Capital expenditure at the end of FY19 is expected at come in around $6.3 billion, higher than the company’s original budget of $6.1 billion on account of the additional appraisal drilling in Alaska and the addition of a drilling rig in the Eagle Ford at mid-year FY19.This guidance excludes approximately $0.3 billion for opportunistic acquisitions completed or announced and results in total capital expenditures and investments of $6.6 billion. The company expects full-year DD&A at $6.3 billion. Exploration Dry Hole and leasehold impairment expenses are estimated at $0.2 billion for FY19. The company expects FY20 production guidance at 1240 MBOED to 1310 MBOED with a capital expenditure of $6.5 billion to $6.7 billion.
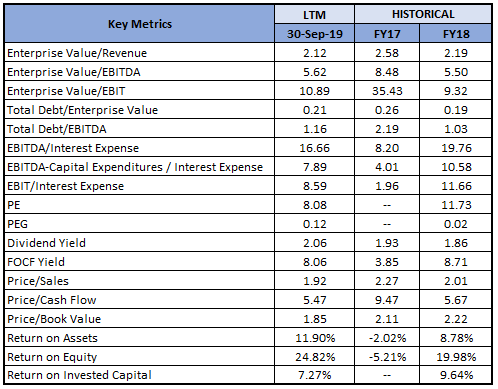
Key Valuation Metrics (Source: Thomson Reuters)
Valuation Methodologies:
Method 1: Price to Cash Flow Multiple Approach:
.png)
Price to Cash Flow Based Valuation (Source: Thomson Reuters), *NTM-Next Twelve Months
Method 2: Enterprise Value to EBITDA Multiple Approach:
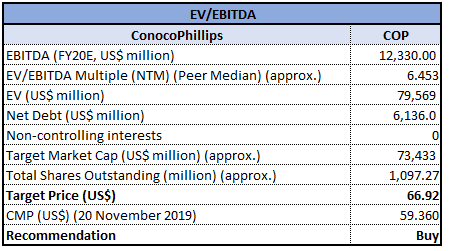
EV/EBITDA Based Valuation (Source: Thomson Reuters), *NTM-Next Twelve Months
Note: All forecasted figures and peers have been taken from Thomson Reuters, *NTM-Next Twelve Months
Stock Recommendation: At the market close, the stock of COP closed at $59.36 with a price to earnings multiple of 8.08x and market capitalization of ~$65.133 billion. The company produced 1.32 million barrels of oil equivalent a day, up 7% on an underlying basis compared to year-on year basis, and up 12% on a per share basis. Cash from operations was $2.6 billion, resulting in a free cash flow of $1 billion in the third quarter of FY19 and $4 billion year-to-date. Third quarter 2019 ended with $8.4 billion of cash and short-term investments. During the quarter, the company executed turnarounds in Alaska, Malaysia and Norway, followed by increased production from the Lower 48 Big 3 unconventionals by 21% on y-o-y basis. Considering the aforesaid facts, we have valued the stock, using two relative valuation methods, i.e., Price to Cash Flow multiple, and Enterprise Value to EBITDA multiple, and arrived at a target price of lower double-digit growth (in % term). Hence, we recommend a “Buy” rating on the stock at the closing price of $59.36, up 3.83% on 20 November 2019.
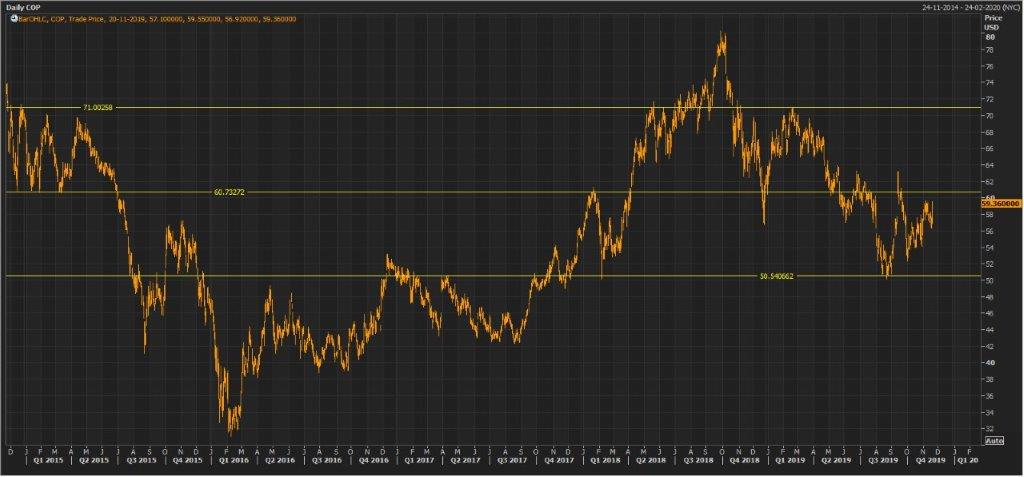
COP Daily Technical Chart (Source: Thomson Reuters)
Disclaimer
The advice given by Kalkine Pty Ltd and provided on this website is general information only and it does not take into account your investment objectives, financial situation or needs. You should therefore consider whether the advice is appropriate to your investment objectives, financial situation and needs before acting upon it. You should seek advice from a financial adviser, stockbroker or other professional (including taxation and legal advice) as necessary before acting on any advice. Not all investments are appropriate for all people. Kalkine.com.au and associated websites are published by Kalkine Pty Ltd ABN 34 154 808 312 (Australian Financial Services License Number 425376). The information on this website has been prepared from a wide variety of sources, which Kalkine Pty Ltd, to the best of its knowledge and belief, considers accurate. You should make your own enquiries about any investments and we strongly suggest you seek advice before acting upon any recommendation. Kalkine Pty Ltd has made every effort to ensure the reliability of information contained in its newsletters and websites. All information represents our views at the date of publication and may change without notice. To the extent permitted by law, Kalkine Pty Ltd excludes all liability for any loss or damage arising from the use of this website and any information published (including any indirect or consequential loss, any data loss or data corruption). If the law prohibits this exclusion, Kalkine Pty Ltd hereby limits its liability, to the extent permitted by law to the resupply of services. There may be a product disclosure statement or other offer document for the securities and financial products we write about in Kalkine Reports. You should obtain a copy of the product disclosure statement or offer document before making any decision about whether to acquire the security or product. The link to our Terms & Conditions has been provided please go through them and also have a read of the Financial Services Guide. On the date of publishing this report (mentioned on the website), employees and/or associates of Kalkine Pty Ltd do not hold positions in any of the stocks covered on the website. These stocks can change any time and readers of the reports should not consider these stocks as advice or recommendations.
 Please wait processing your request...