
Section 1: Company Overview and Fundamentals
1.1 Company Overview:
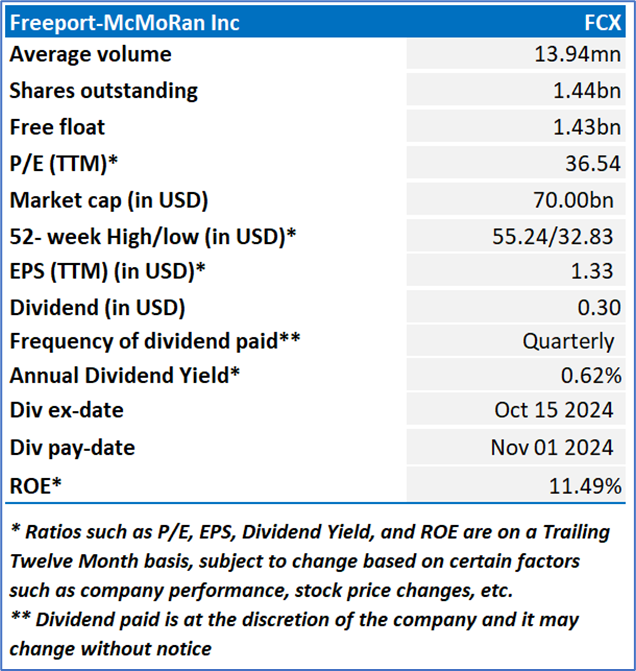
Freeport-McMoRan Inc. (NYSE: FCX) is an international mining company. The Company operates geographically diverse assets with significant proven and probable reserves of copper, gold and molybdenum. Its portfolio of assets includes the Grasberg minerals district in Indonesia, which is a copper and gold deposits, and significant mining operations in North America and South America, including the Morenci minerals district in Arizona and the Cerro Verde operation in Peru.
Kalkine’s Diversified Opportunities Report covers the Company Overview, Key positives & negatives, Investment summary, Key investment metrics, Top 10 shareholding, Business updates and insights into company recent financial results, Key Risks & Outlook, Price performance and technical summary, Target Price, and Recommendation on the stock.
Stock Performance:
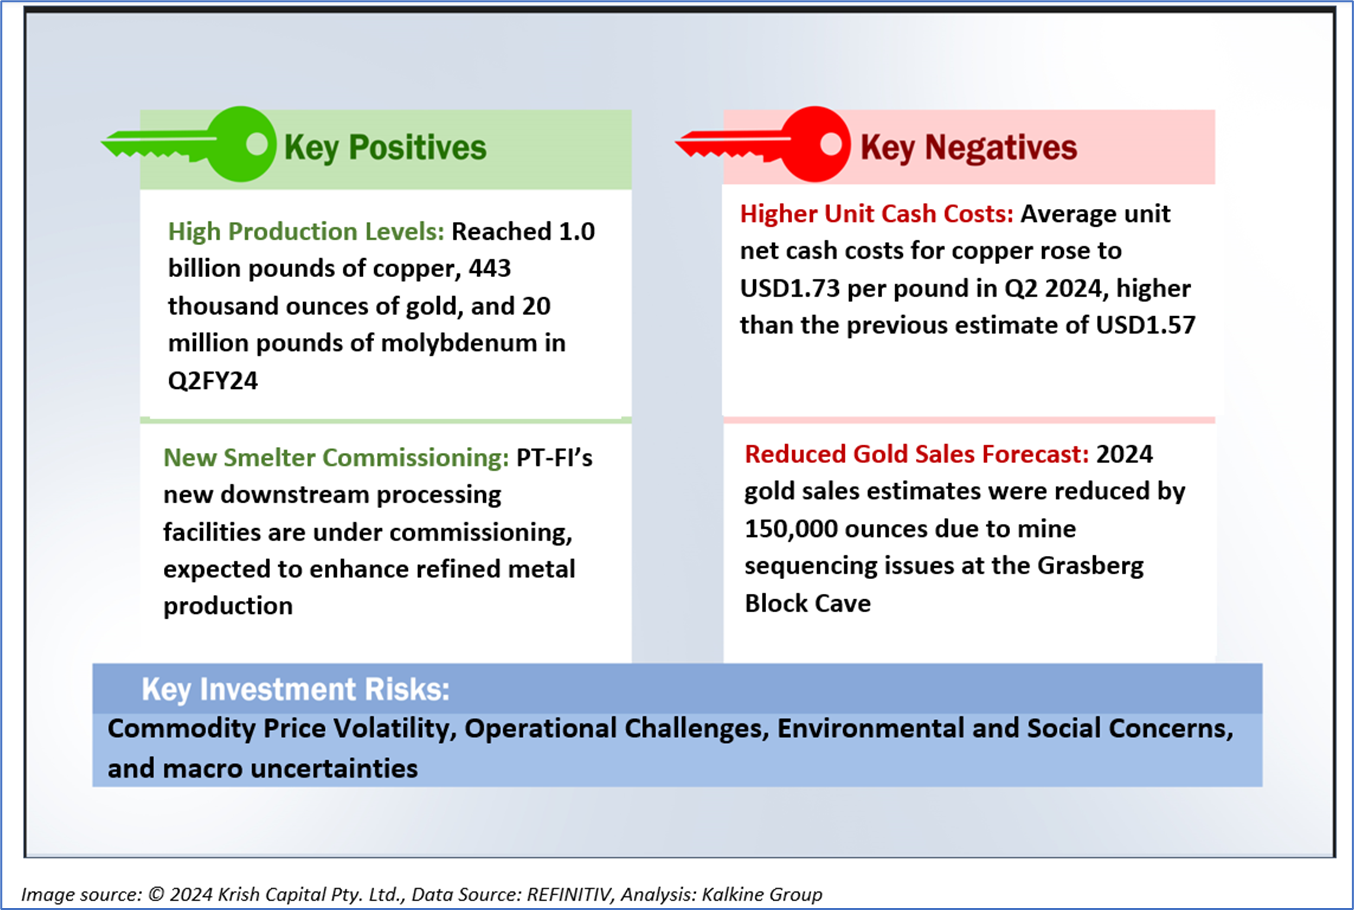
1.2 The Key Positives, Negatives, and Investment summary
1.3 Top 10 shareholders:
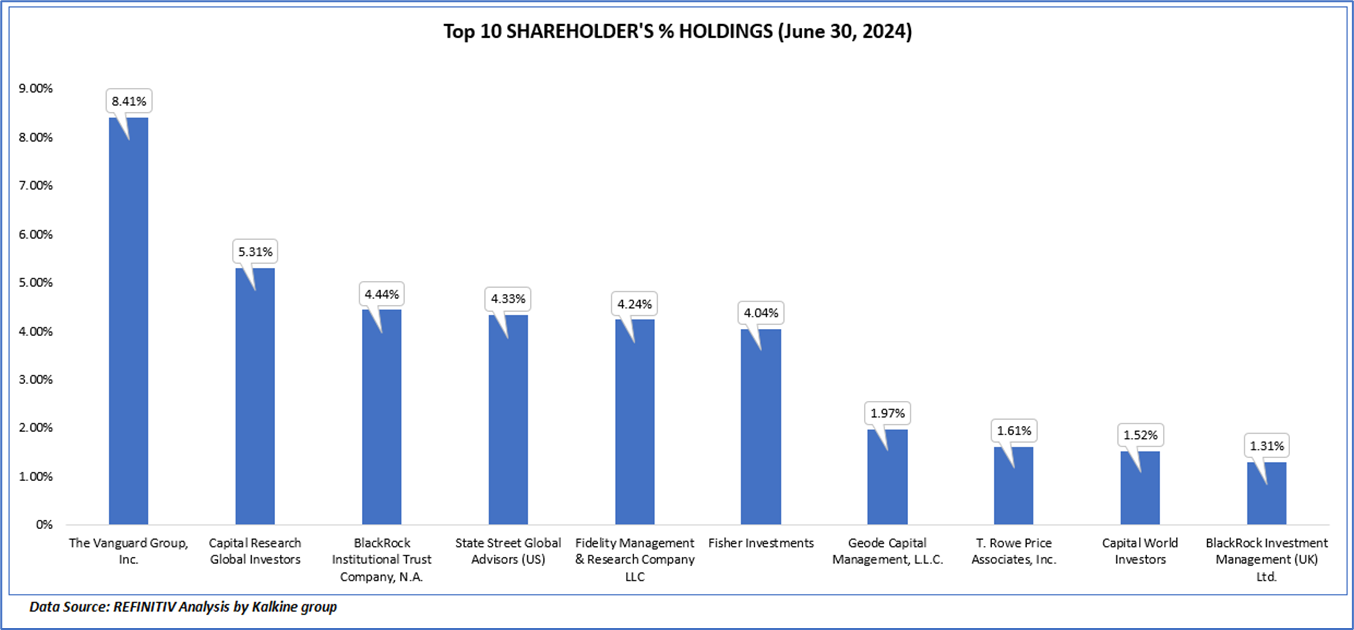
The top 10 shareholders together form ~37.18% of the total shareholding, signifying concentrated shareholding. The Vanguard Group, Inc., and Capital Research Global Investors, are the biggest shareholders, holding the maximum stake in the company at 8.41% and 5.31%, respectively.
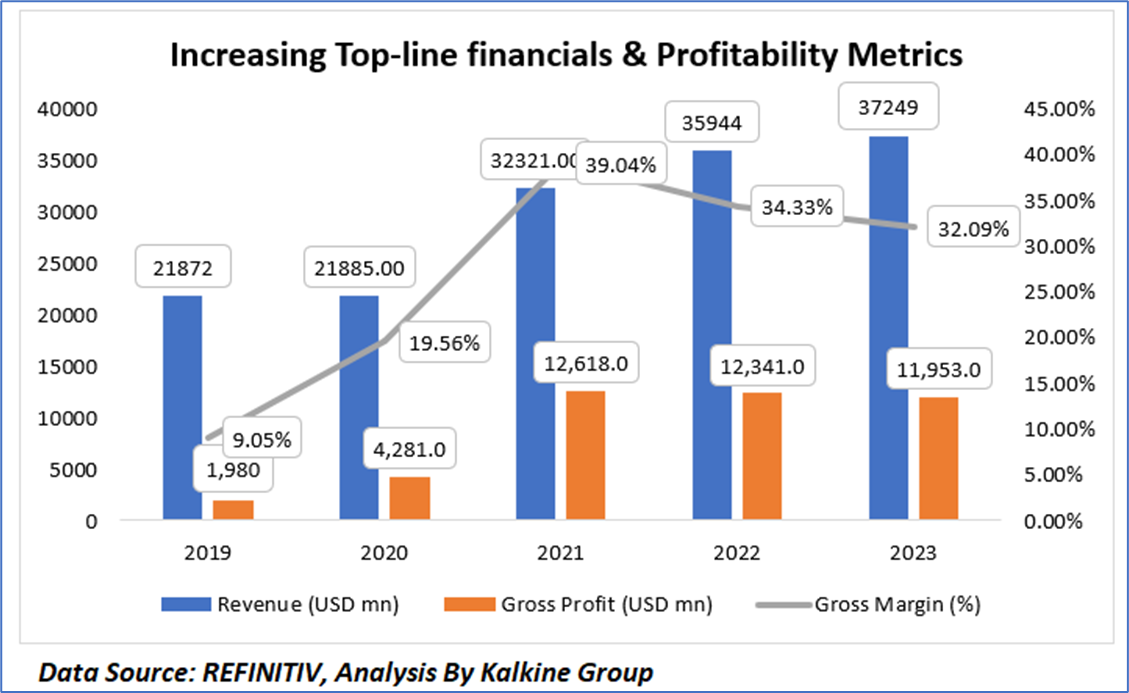
1.4 Key Metrics
Between 2019 and 2023, Freeport-McMoRan (FCX) demonstrated a notable financial performance, reflected in both revenue growth and margin improvements. Revenue increased from USD 21,872 million in 2019 to USD 37,249 million by 2023. During the same period, gross profit surged significantly from USD 1,980 million in 2019 to USD 11,953 million in 2023, driven by operational efficiencies and improved market conditions. FCX’s gross margin followed a similar upward trajectory, rising from 9.05% in 2019 to 32.09% in 2023, despite some minor fluctuations after peaking at 39.04% in 2021. These figures underscore the company’s growing profitability and robust financial health over the past five years.
Section 2: Business Updates and Corporate Business Highlights
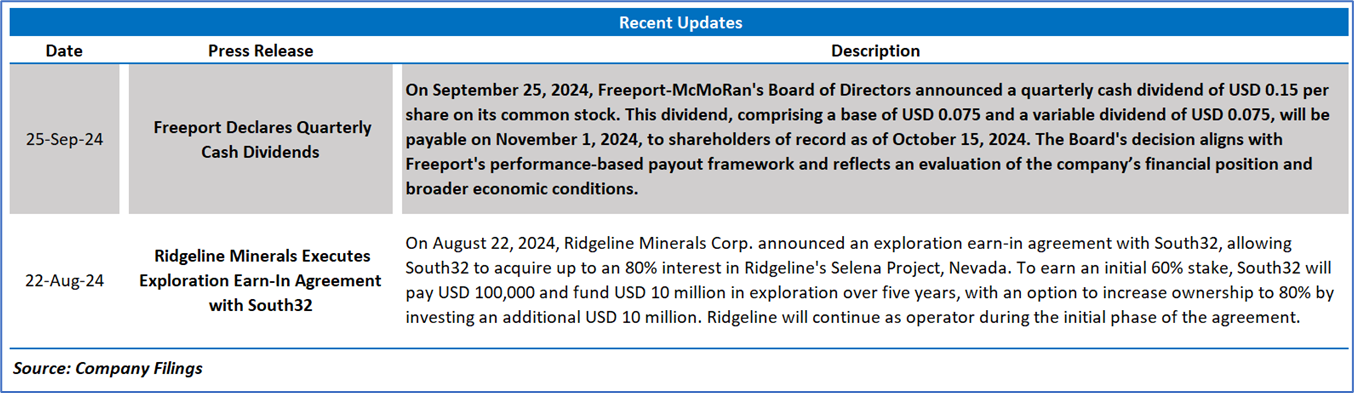
2.1 Recent Updates:
The below picture gives an overview of the recent updates:
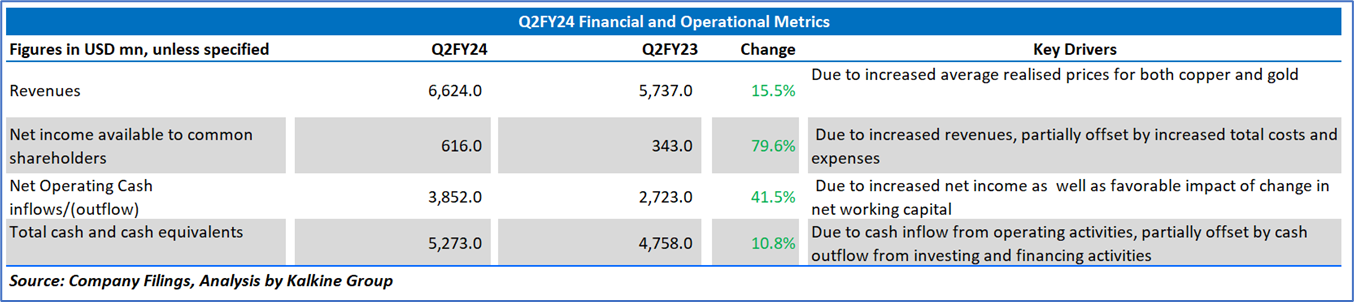
2.2 Insights of Q2FY24:
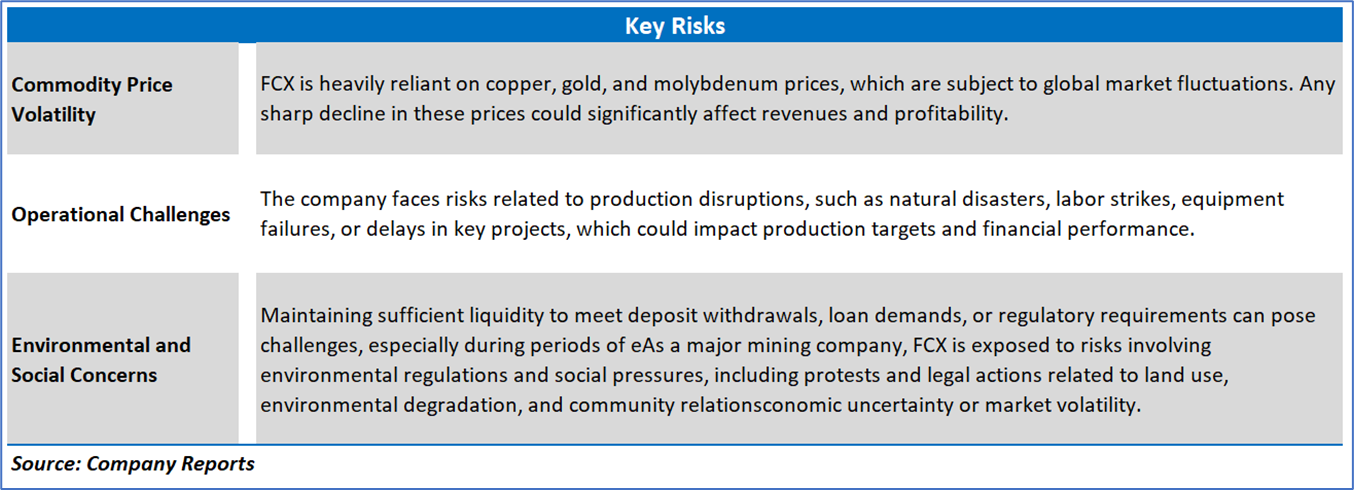
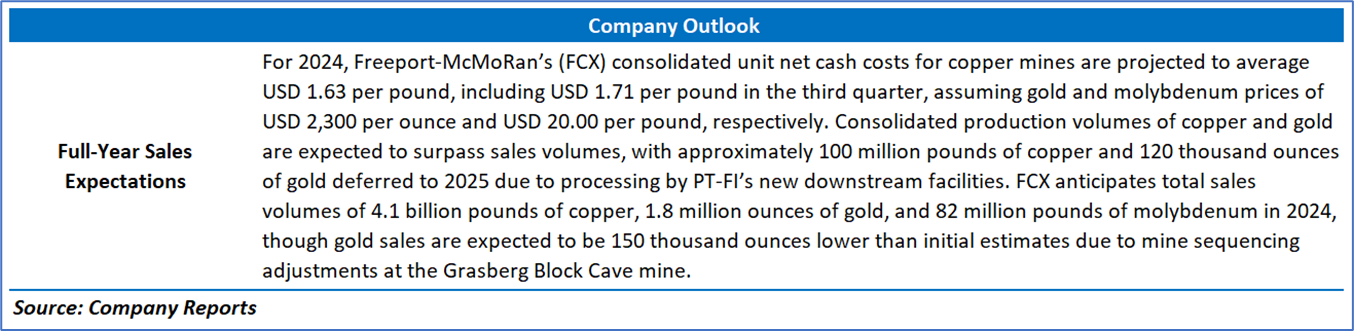
Section 3: Key Risks & Outlook
Section 4: Stock Recommendation Summary:
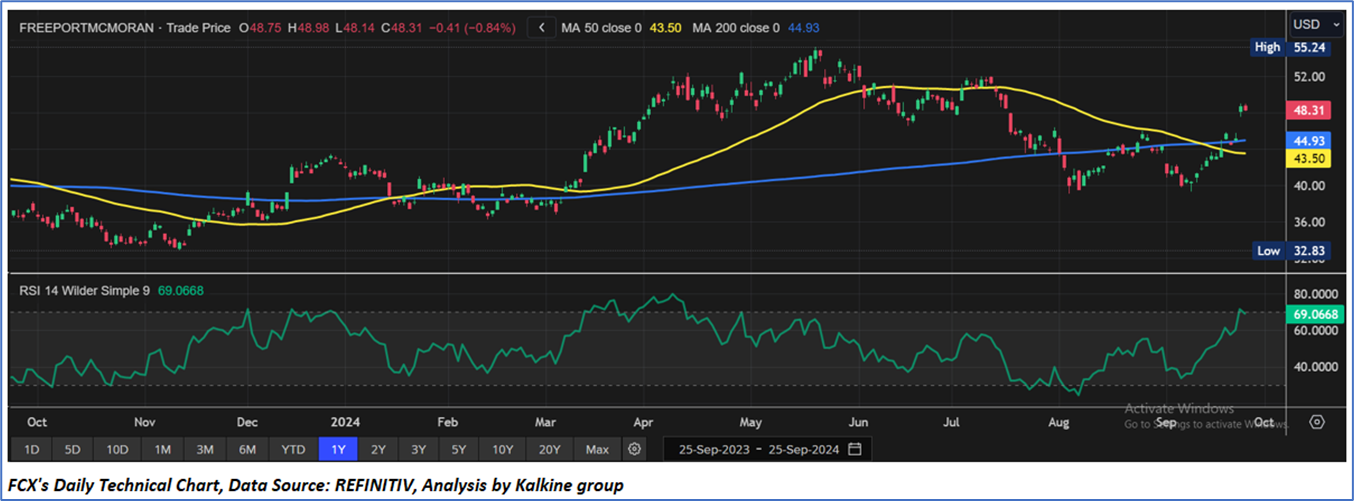
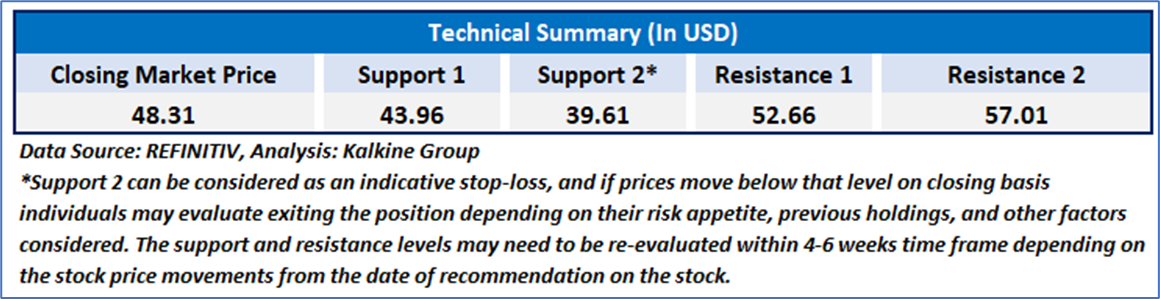
4.1 Price Performance and Technical Summary:
Stock Performance:
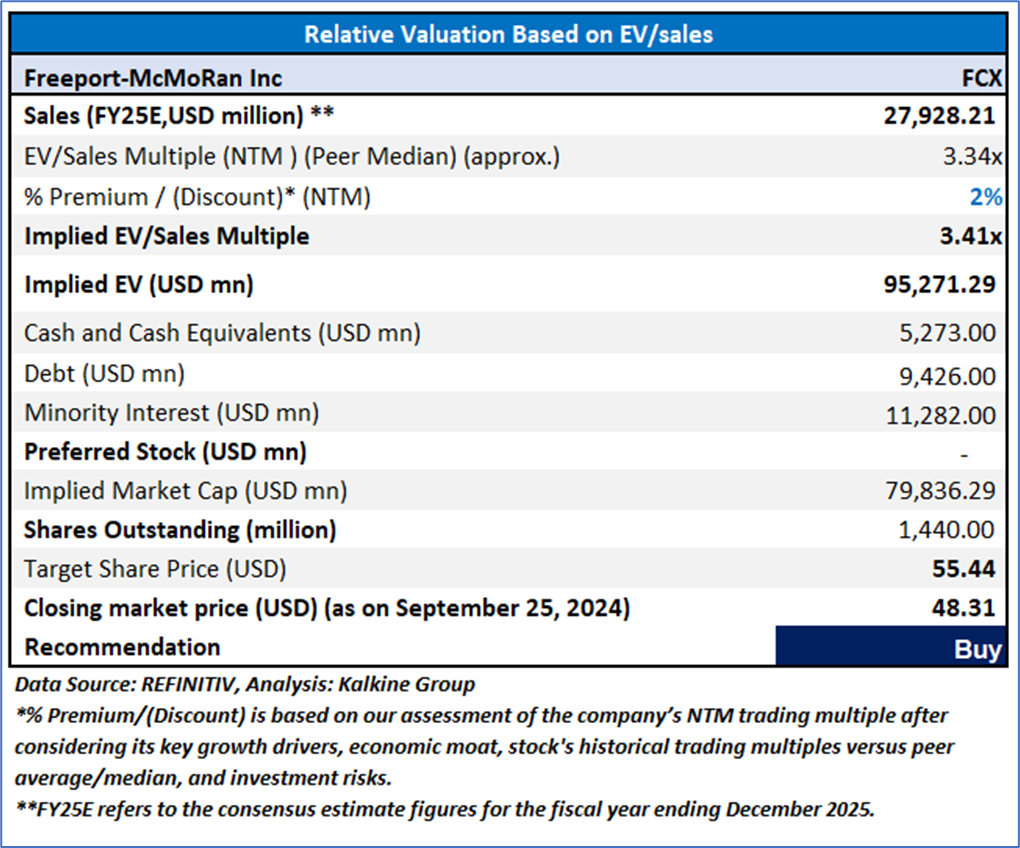
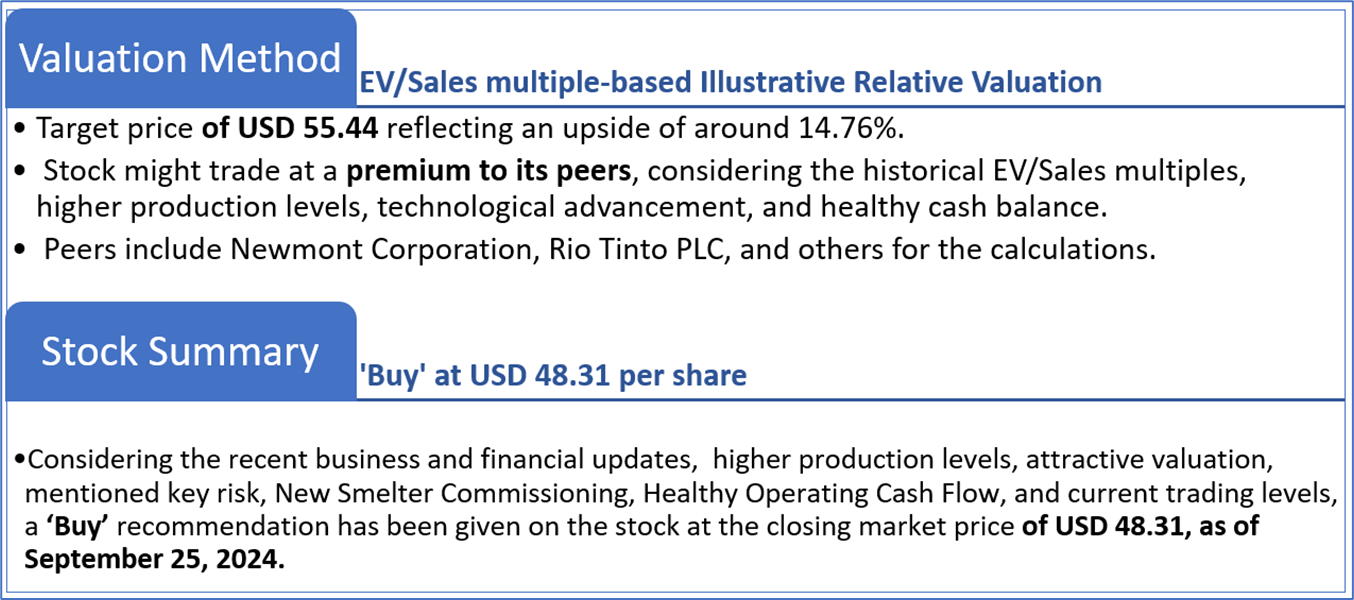
4.2 Fundamental Valuation
Valuation Methodology: EV/Sales Multiple Based Relative Valuation
Markets are trading in a highly volatile zone currently due to certain macroeconomic issues and geopolitical tensions prevailing. Therefore, it is prudent to follow a cautious approach while investing.
Note 1: Past performance is not a reliable indicator of future performance.
Note 2: The reference date for all price data, currency, technical indicators, support, and resistance levels is September 25, 2024. The reference data in this report has been partly sourced from REFINITIV.
Note 3: Investment decisions should be made depending on an individual's appetite for upside potential, risks, holding duration, and any previous holdings. An 'Exit' from the stock can be considered if the Target Price mentioned as per the Valuation and or the technical levels provided has been achieved and is subject to the factors discussed above.
Note 4: The report publishing date is as per the Pacific Time Zone.
Technical Indicators Defined: -
Support: A level at which the stock prices tend to find support if they are falling, and a downtrend may take a pause backed by demand or buying interest. Support 1 refers to the nearby support level for the stock and if the price breaches the level, then Support 2 may act as the crucial support level for the stock.
Resistance: A level at which the stock prices tend to find resistance when they are rising, and an uptrend may take a pause due to profit booking or selling interest. Resistance 1 refers to the nearby resistance level for the stock and if the price surpasses the level, then Resistance 2 may act as the crucial resistance level for the stock.
Stop-loss: It is a level to protect against further losses in case of unfavorable movement in the stock prices.
The advice given by Kalkine Canada Advisory Services Inc. and provided on this website is general information only and it does not take into account your investment objectives, financial situation and the particular needs of any particular person. You should therefore consider whether the advice is appropriate to your investment objectives, financial situation and needs before acting upon it. You should seek advice from a financial adviser, stockbroker or other professional (including taxation and legal advice) as necessary before acting on any advice. Not all investments are appropriate for all people. The website www.kalkine.ca is published by Kalkine Canada Advisory Services Inc. The link to our Terms & Conditions has been provided please go through them. On the date of publishing this report (mentioned on the website), employees and/or associates of Kalkine do not hold positions in any of the stocks covered on the website. These stocks can change any time and readers of the reports should not consider these stocks as advice or recommendations later.
 Please wait processing your request...