
Company overview - General Electric Company is a global digital industrial company. The Company's products and services range from aircraft engines, power generation, and oil and gas production equipment to medical imaging, financing and industrial products. Its segments include Power, which includes products and services related to energy production and water reuse; Renewable Energy, which offers renewable power sources; Oil & Gas, including liquefied natural gas and pipelines; Aviation, which includes commercial and military aircraft engines, and integrated digital components, among others; Healthcare, which provides healthcare technologies in medical imaging, digital solutions, patient monitoring and diagnostics, and drug discovery, among others; Transportation, which is a supplier to the railroad, mining, marine, stationary power and drilling industries; Energy Connections & Lighting, which includes Energy Connections and Lighting businesses, and Capital, which is a financial services division.
.PNG)
GE Details
General Electric (NYQ: GE) has witnessed a lot of challenges in the current year and has been thrashed down close to its 52-week low levels. However, GE has undertaken many transformational changes and streamlined its business for better value. Investment in improved and high-tech products while maintaining an income stream for shareholders are re-setting the base.
Significant improvement in cash flows from Industrial division in Q2FY17: Consolidated revenue for the second quarter declined by 12% yoy to $29.6 billion primarily led by negative growth in Transportation, Energy Connections & Lighting and Capital segments. In turn, Earnings (loss) from continuing operations fell 59% yoy to $1.3 billion, largely impacted by Oil & Gas division due to volatility in oil prices. However, Cash flow from GE’s Industrial segment operating activities significantly improved to $1.5 billion both sequentially and correspondingly led by $670 million reduction in Industrial structural costs. Notably, the company is on track to achieve its $1 billion cost reduction target for the year and expects cash flow to continue to improve throughout the year. During the quarter, the company has returned $3.6 billion to shareholders through buyback and totalling $7.8 billion cash returns in H1FY17.
.png)
Q2FY17 Financial summary; (Source: Company reports)
Mixed result for H1FY17: For H1FY17, General Electric Company’s revenue declined 7% yoy (year on year) to $57.2 billion, led by 31% decline in Energy Connections & Lighting segment to $5.9 billion and 9% decline in GE Capital segment to $5.1 billion. Moreover, Industrial revenues included a pre-tax gain of $3.1 billion from the sale of Appliances business to Haier in the second quarter of 2016. The additional decrease in revenues was due to a decrease in industrial segment revenues of ~1%, as the net effects of dispositions of $2.8 billion and the effects of a stronger U.S. dollar of $0.3 billion were partially offset by organic revenue increases of $2.3 billion and the net effects of acquisitions of $0.3 billion.
Accordingly, consolidated earnings declined 38% yoy to $2.2 billion led by 33% decline in Energy Connections & Lighting segment and 43% decline in Oil & Gas segment. The net effect of acquisitions on consolidated operating earnings was a decrease of $0.1 billion while the net effect of dispositions was a decrease of $2.6 billion in 2017 and a gain of $1.9 billion in 2016. Additionally, Foreign exchange movements adversely affected industrial operating earnings by $0.2 billion as a result of both translational and transactional impacts related to re-measurement and mark-to-market charges on open hedges. On the other hand, Financial Services losses decreased 85% primarily due to lower treasury and headquarters operation expenses, lower preferred dividend expenses associated with the January 2016 preferred equity exchange, and lower restructuring expenses associated with the GE Capital Exit Plan. Further, earnings per share amounts for 2017 were positively impacted by the reduction in number of outstanding common shares compared to 2016.
.png)
Segment revenue summary; (Source: Company reports)
Industrial segment equipment & services: For H1FY17, Industrial segment revenues decreased 1% to $54.1 billion, driven by decreases at Energy Connections & Lighting primarily due to the sale of the Appliances business in the second quarter of 2016, Oil & Gas due to market conditions, and Transportation, and an unfavourable foreign exchange impact, partially offset by increases at Power, Renewable Energy, Aviation and Healthcare. However, segment profit increased 2% to $7.6 billion, led by higher earnings at Aviation and Power, partially offset by lower earnings at Oil & Gas as well as an unfavourable foreign exchange impact and the effects of the sale of Appliances in the second quarter of 2016. Further, the segment margin increased 40 bps to 14.0% in 2017 from 13.6% in 2016 driven by positive cost productivity, partially offset by negative business mix. Importantly, the increase in industrial segment margin reflects improvement at Aviation, Renewable Energy and Healthcare, offset by decreases at Oil & Gas, Transportation and Power.
Power segment earnings led by higher volumes: Power segment revenues grew 10% yoy to 13.0 billion, driven by higher equipment volume, primarily at Gas Power Systems as a result of extended scope including higher balance of plant as well as two more gas turbine shipments and 29 more Heat Recovery Steam Generator shipments during the year. Revenue growth was also led by increased other income including a reduction in foreign exchange transactional losses, partially offset by lower prices and the effects of a stronger U.S. dollar versus the euro. In turn, the increase in profit was led by positive base cost productivity on higher volume as well as increased other income including a reduction in foreign exchange transactional losses, partially offset by an unfavourable business mix due to higher equipment volume versus services volume.
.png)
Power segment financial overview; (Source: Company reports)
Renewable energy earnings led by material deflation and other income: Revenue grew 20% yoy to $4.5 billion, primarily driven by higher volume due to higher equipment sales at Hydro and increased repowering projects at Onshore Wind. In addition, while there were 200 fewer wind turbine shipments than in the prior year, megawatts shipped increased by 4%. Additionally, revenue also increased due to the effects of a weaker U.S. dollar versus the Brazilian real and increased other income including a reduction in foreign exchange transactional losses, partially offset by lower prices. Mainly, the increase in profit was led by material deflation and increased other income including a reduction in foreign exchange transactional losses. However, these increases were partially offset by negative cost productivity and lower prices.
Oil & Gas segment impacted by negative market conditions: For H1FY17, revenue from Oil & Gas segment declined 6% to $6.1 billion, primarily driven by negative market conditions that resulted in lower equipment volume in Subsea & Drilling and Turbomachinery & Process Solutions. Further, revenues also decreased due to lower prices and the effects of a stronger U.S. dollar versus the euro and the pound sterling, partially offset by increased other income including a reduction in foreign exchange transactional losses. On the other hand, the decrease in operating profit was primarily market driven resulting in lower prices. Despite the effects of restructuring actions and an increase in earnings in long-term service contracts, profit decreased due to negative variable cost productivity.
.png)
Oil & Gas segment financial summary; (Source: Company reports)
Aviation led by higher service volumes: The 4% yoy increase in revenue at $13.3 billion was primarily due to higher services volume including an increase in the commercial spares shipment rates, military spare parts shipments, and higher prices. However, equipment revenue decreased primarily due to 119 fewer Commercial engine shipments and 45 fewer Military engine shipments, partially offset by higher valued commercial shipments including 163 more LEAP (Leading Edge Aviation Propulsion) engine shipments. The segment profit grew 11% to $3.2 billion, mainly driven by positive cost productivity, higher services volume and higher prices for Commercial Engines & Services, partially offset by unfavourable business mix due to negative LEAP margin impact.
.png)
Aviation financial summary; (Source: Company reports)
Healthcare segment earnings driven by positive cost productivity: Revenue grew 3% yoy to $ 9.0 billion, led by higher services and equipment volume driven by Healthcare Systems and Life Sciences. However, the growth was partially offset by lower prices at Healthcare Systems and the effects of a stronger U.S. dollar versus the euro and the Chinese renminbi. The moderate improvement in profit was mainly due to positive cost productivity driven by cost savings resulting from previous restructuring actions, as well as higher volume, partially offset by lower prices at Healthcare Systems and inflation.
Transportation, Energy connections & Lighting: Revenue from Transportation and Energy connections & Lighting declined 5% yoy and 31% yoy to $2.1 billion, $5.9 billion respectively. Decline in the Transportation revenue was led by lower locomotive equipment volume as a result of decreased North America shipments, partially offset by increased international shipments. On the other hand, fall in Energy connections & Lighting revenue was on account of the Appliances disposition in June 2016 as well as lower GE Lighting revenues driven by declines in traditional lighting product. Moreover, Energy Connections remained flat as increased volume at Grid Solutions was offset by a decrease at Power Conversion. Additionally, revenues decreased due to lower prices and the effects of a stronger U.S. dollar versus the pound sterling and the euro.
.png)
Energy connections & Lighting financial summary; (Source: Company reports)
Improved earnings from Capital division led by lower operating expenses: Capital revenues dropped 9% yoy, primarily due to organic revenue decline, lower gains and higher impairments. On the other hand, losses were reduced by $1.3 billion (85%), primarily due to lower treasury and headquarters operation expenses, lower preferred dividend expenses, and lower restructuring expenses associated with the GE Capital Exit Plan. Within Capital, Verticals net earnings increased $0.1 billion, or 14%, due to core increases ($0.2 billion) and lower impairments ($0.1 billion), partially offset by lower gains ($0.1 billion). Additionally, other Capital losses decreased $1.1 billion (47%), primarily associated with the GE Capital Exit Plan.
Stock performance: The shares of GE have declined about 20.3% in the last one year, owing to subdued financials led by challenging business environment for Oil & Gas division and geopolitical and economic events like Brexit. Further, the stock price was impacted by negative sentiment as the Warren Buffet’s Berkshire Hathaway sold its holding in GE. Currently, the stock is trading at 52- week low levels while having a decent dividend yield. Given the ongoing restructuring of the business and other transformation changes towards digital technologies, improving cash flows from Industrial segment aided by cost reductions and performance in sectors including renewable energy and aviation, we give a “Buy” recommendation on the stock at the current market price of $24.92
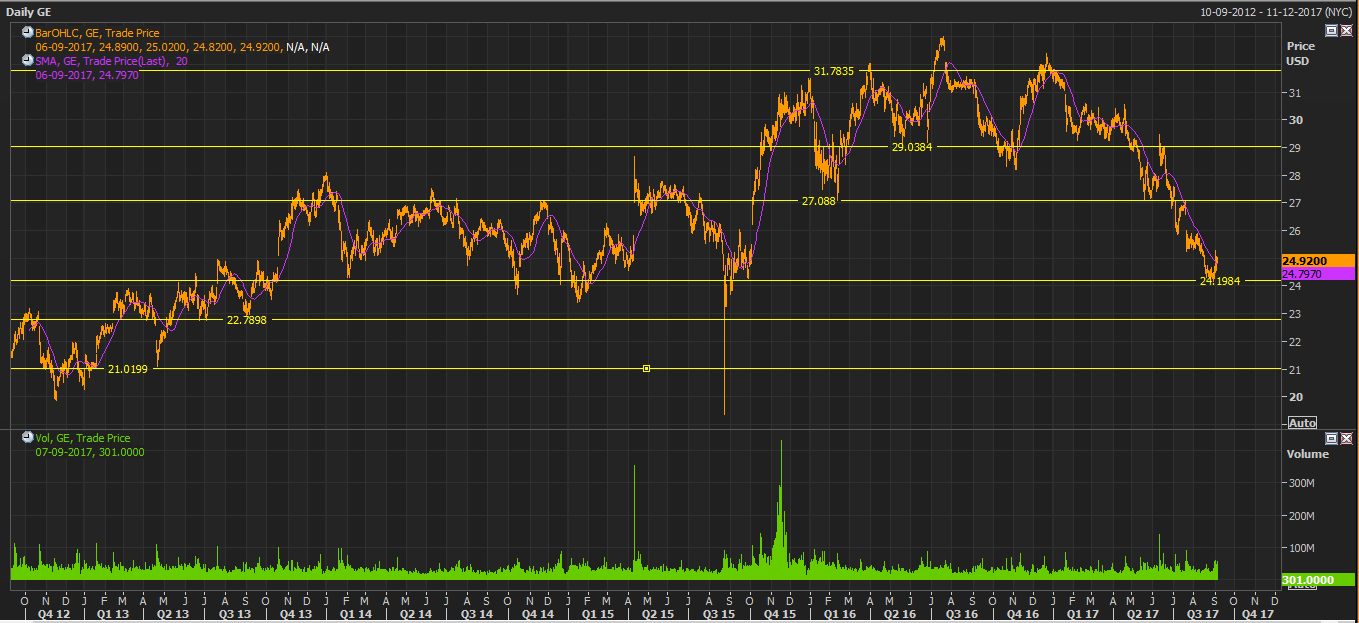
GE Daily Chart (Source: Thomson Reuters)
Disclaimer
The advice given by Kalkine Pty Ltd and provided on this website is general information only and it does not take into account your investment objectives, financial situation or needs. You should therefore consider whether the advice is appropriate to your investment objectives, financial situation and needs before acting upon it. You should seek advice from a financial adviser, stockbroker or other professional (including taxation and legal advice) as necessary before acting on any advice. Not all investments are appropriate for all people. Kalkine.com.au and associated websites are published by Kalkine Pty Ltd ABN 34 154 808 312 (Australian Financial Services License Number 425376). The information on this website has been prepared from a wide variety of sources, which Kalkine Pty Ltd, to the best of its knowledge and belief, considers accurate. You should make your own enquiries about any investments and we strongly suggest you seek advice before acting upon any recommendation. Kalkine Pty Ltd has made every effort to ensure the reliability of information contained in its newsletters and websites. All information represents our views at the date of publication and may change without notice. To the extent permitted by law, Kalkine Pty Ltd excludes all liability for any loss or damage arising from the use of this website and any information published (including any indirect or consequential loss, any data loss or data corruption). If the law prohibits this exclusion, Kalkine Pty Ltd hereby limits its liability, to the extent permitted by law to the resupply of services. There may be a product disclosure statement or other offer document for the securities and financial products we write about in Kalkine Reports. You should obtain a copy of the product disclosure statement or offer document before making any decision about whether to acquire the security or product. The link to our Terms & Conditions has been provided please go through them and also have a read of the Financial Services Guide. On the date of publishing this report (mentioned on the website), employees and/or associates of Kalkine Pty Ltd do not hold positions in any of the stocks covered on the website. These stocks can change any time and readers of the reports should not consider these stocks as advice or recommendations
 Please wait processing your request...